Categories
Security & Monitoring

Unexpected CloudWatch In The Billing Area

In this post I will investigate an unexpected CloudWatch charge on my April 2022 AWS bill, and explain how to interpret the bill and find the resources responsible.

Table of Contents

Introduction

My April 2022 AWS bill has arrived. The total wasn’t unusual – £4.16 is a pretty standard charge for me at the moment, most of which is S3. Then I took a closer look at the services and found an unexpected cost for CloudWatch, which is usually zero.

But not this month:

While $0.30 isn’t bank-breaking, it is unexpected and worth investigating. More importantly, nothing should be running in EU London! And there were no CloudWatch changes at all on my March 2022 bill. So what’s going on here?

Let’s start with the bill itself.

The April 2022 Bill

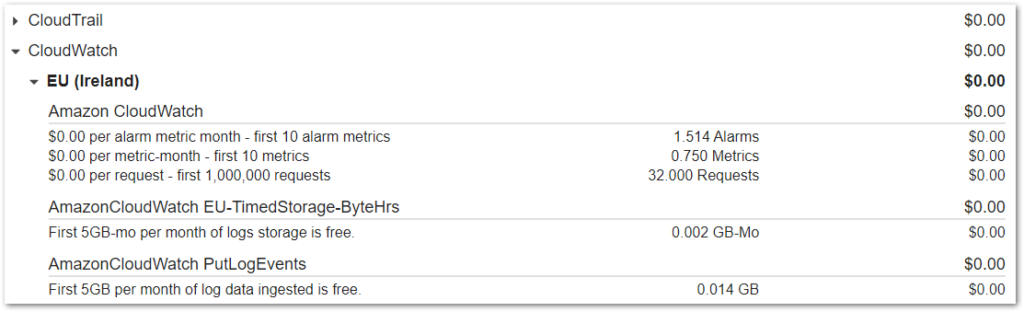
Looking at the bill, the rows with unexpected CloudWatch charges all mention alarms. Since nothing else has generated any charges, let’s take a closer look at all of the rows referring to alarms.

$0.00 Per Alarm Metric Month – First 10 Alarm Metrics – 10.000 Alarms

The AWS Always Free Tier includes ten CloudWatch alarms.

$0.10 Per Alarm Metric Month (Standard Resolution) – EU (Ireland) – 2.000002 Alarms

In EU Ireland, each standard resolution alarm after the first ten costs $0.10. The bill says there are twelve alarms in EU Ireland – ten of these are free and the other two cost $0.10 each – $0.20 in total.

$0.10 Per Alarm Metric Month (Standard Resolution) – EU (London) – 1.000001 Alarms

CloudWatch standard resolution alarms also cost $0.10 in EU London. As all my free alarms are seemingly in EU Ireland, the one in EU London costs a further $0.10.

So the bill is saying I have thirteen alarms – twelve in EU Ireland and one in EU London. Let’s open CloudWatch and see what’s going on there.

CloudWatch Alarm Dashboard

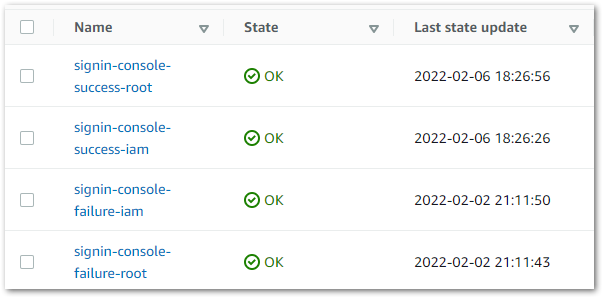
It seems I have thirteen CloudWatch alarms. Interesting, because I could only remember the four security alarms I set up in February.

CloudWatch says otherwise. This is my current EU Ireland CloudWatch dashboard:

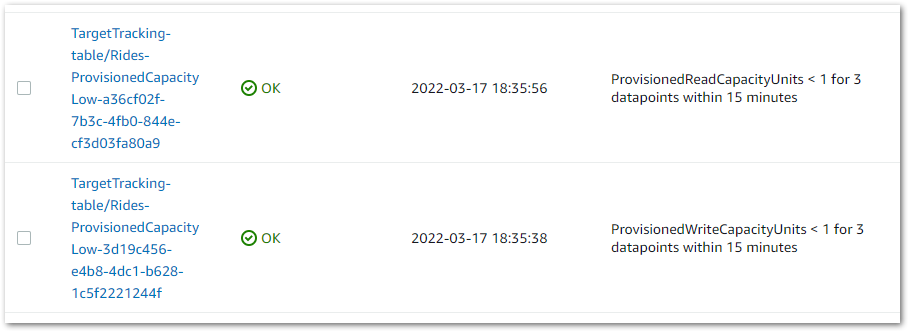
Closer inspection finds eight alarms with names like:

  • TargetTracking-table/Rides-ProvisionedCapacityHigh-a53f2f67-9477-45a6-8197-788d2c7462b3
  • TargetTracking-table/Rides-ProvisionedCapacityLow-a36cf02f-7b3c-4fb0-844e-cf3d03fa80a9

Two of these are constantly In Alarm, and all have Last State Update values on 2022-03-17. The alarm names led me to suspect that DynamoDB was involved, and this was confirmed by viewing the Namespace and Metric Name values in the details of one of the alarms:

At this point I had an idea of what was going on. To be completely certain, I wanted to check my account history for 2022-03-17. That means a trip to CloudTrail!

CloudTrail Event History

CloudTrail’s Event History shows the last 90 days of management events. I entered a date range of 2022-03-17 00:00 > 2022-03-18 00:01 into the search filter, and it didn’t take long to start seeing some familiar-looking Resource Names:

Alongside the TargetTracking-table resource names linked to monitoring.amazonaws.com, there are also rows on the same day for other Event Sources including:

  • dynamodb.amazonaws.com
  • apigateway.amazonaws.com
  • lambda.amazonaws.com
  • cognito-idp.amazonaws.com

I now know with absolute certainty where the unexpected CloudWatch alarms came from. Let me explain.

Charge Explanations

So far I’ve reviewed my bills, found the CloudWatch alarms and established what was happening in my account when they were added. Now I’ll explain how this all led to charges on my bill.

The $0.20 EU Ireland Charge

When I was recently studying for the Developer Associate certification, I followed an AWS tutorial on how to Build a Serverless Web Application with AWS Lambda, Amazon API Gateway, AWS Amplify, Amazon DynamoDB, and Amazon Cognito. This was to top up my serverless knowledge before the exam.

The third module involves creating a DynamoDB table for the application. A table that I provisioned with auto-scaling for read and write capacity:

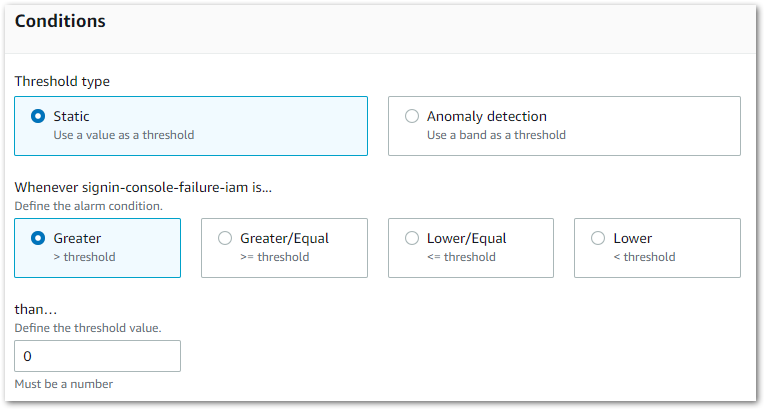
These auto-scaling policies rely on CloudWatch alarms to function, as demonstrated by some of the alarm conditions:

The DynamoDB auto-scaling created eight CloudWatch alarms. Four for Read Capacity Units:

  • ConsumedReadCapacityUnits > 42 for 2 datapoints within 2 minutes
  • ConsumedReadCapacityUnits < 30 for 15 datapoints within 15 minutes
  • ProvisionedReadCapacityUnits > 1 for 3 datapoints within 15 minutes
  • ProvisionedReadCapacityUnits < 1 for 3 datapoints within 15 minutes

And four for Write Capacity Units:

  • ConsumedWriteCapacityUnits > 42 for 2 datapoints within 2 minutes
  • ConsumedWriteCapacityUnits < 30 for 15 datapoints within 15 minutes
  • ProvisionedWriteCapacityUnits > 1 for 3 datapoints within 15 minutes
  • ProvisionedWriteCapacityUnits < 1 for 3 datapoints within 15 minutes

These eight alarms joined the existing four. The first ten were free, leaving two accruing charges.

This also explains why two alarms are always In Alarm – the criteria for scaling in are being met but the DynamoDB table can’t scale down any further.

I could have avoided this situation by destroying the resources after finishing the tutorial. The final module of the tutorial covers this. Instead I decided to keep everything around so I could take a proper look at everything under the hood.

No resources accrued any charges in March, so I left everything in place during April. I’ll go into why there was nothing on the March bill shortly, but first…

The $0.10 EU London Charge

Remember when I said that I shouldn’t be running anything in EU London? Turns out I was!

I found a very old CloudWatch alarm from 2020. It’s been there ever since. Never alerting so I didn’t know it was there. Included in the Always Free tier, so never costing me anything or triggering an AWS Budget alert. Appearing on my bill, but always as a free entry so never drawing attention.

When I exceeded my ten free CloudWatch alarms, the one in EU London became chargeable for the first time. A swift delete later and that particular problem is no more.

No CloudWatch Charge On The March 2022 Bill

That only leaves the question of why there were no CloudWatch charges on my March 2022 bill, despite there being thirteen alarms on my account for almost half of that month:

I wanted to understand what was going on, so I reached out to AWS Support.

In what must have been a first for them, I asked why no money had been billed for CloudWatch in March:

On my April 2022 bill I was charged $0.30 for CloudWatch. $0.20 in Ireland and $0.10 in London. I understand why.

What I want to understand is why I didn’t see a charge for them on my March 2022 bill. The alerts were added to the account on March 17th, so from that moment on I had thirteen alerts which is three over the free tier.

Can I get confirmation on why they don’t appear on March but do on April please?

I soon received a reply from AWS Support that explained the events in full:

…although you enabled all 13 Alarms in March, the system only calculated a pro-rated usage value, since the Alarms were only enabled on 17th March. The pro-rated Alarm usage values only amounted to 7.673 Alarms in the EU (Ireland) region, and 1.000003 Alarms in the EU (London) region.

The total pro-rated Alarm usage calculated for March (8.673003 Alarms) is thus within the 10 Alarm Free Tier threshold and thus incurred no charges, whereas in April the full 13 Alarm usage came into play for the entire month…

To summarise, I hadn’t been charged for the alarms in March because they’d only been on my account for almost half a month. Thanks for the help folks!

Summary

In this post I investigated an unexpected CloudWatch charge on my April 2022 AWS bill. I showed what the bill looked like, demonstrated how to find the resources generating the charges and explained how those resources came to be on my AWS account.

If this post has been useful, please feel free to follow me on the following platforms for future updates:

Thanks for reading ~~^~~

Categories
Security & Monitoring

Creating Security Alerts For AWS Console Access

In this post I will use AWS managed services to produce security alerts when attempts are made to access my AWS account’s console.

Table of Contents

Introduction

I am currently studying towards the AWS Certified Developer – Associate certification using Stéphane Maarek’s video course and the Tutorials Dojo practice exams. As part of my studies I want to better understand the various AWS monitoring services, and setting up some security alerts is a great way to get some real-world experience of them.

My current security posture is already in line with AWS best practices. For example:

  • I use a password manager and autogenerate passwords so they’re not reused.
  • MFA is enabled on everything offering it.
  • I have created IAM users and roles for all my AWS requirements and never use my root account.

To strengthen this, I will create some security alerts that will notify me when attempts are made to access my AWS console whether they succeed or fail.

I will be using the following AWS services:

  • IAM for handling authentication requests.
  • CloudTrail for creating log events.
  • CloudWatch for analysing log events and triggering alarms.
  • SNS for sending notifications when alarms are triggered.

The end result will look like this:

Let’s start with IAM.

IAM

AWS Identity and Access Management (IAM) is the AWS tool for managing permissions and access policies. I don’t need to do anything with IAM here, but I include it as IAM is the source of the events that my security alerts will use.

Next I’ll create the setup that AWS will use to send the security alerts.

SNS

Amazon Simple Notification Service (SNS) focuses on delivering notifications from sources to subscribers. SNS offers hundreds of potential combinations, and here I’m using it to send notifications to me in response to certain AWS events.

To do this, SNS uses Topics for what the notifications are and Subscriptions for where to send them.

SNS Topics

SNS Topics can be heavily customised but here I only need a simple setup. First I choose my topic’s type:

Standard is fine here as I don’t need to worry about message ordering or duplication. I also need a name for the topic. I will use the following naming pattern for the topics and for the security alerts themselves:

  • Action – this will always be signin.
  • Signin Method – this will always be console.
  • Outcome – this will be either failure or success.
  • User Type – this will be either iam or root.

Thus my first topic is named signin-console-failure-iam.

I am creating four security alerts and want each to have a separate SNS topic generating different notifications. A short time later I have created all four successfully:

SNS Subscriptions

Now I need some SNS Subscriptions. These tell SNS where to send notifications.

An SNS Subscription needs the following details:

  • Topic ARN – the Amazon Resource Name of the desired SNS Topic.
  • Protocol – there are several choices including email and SMS.
  • Endpoint – this will depend on the choice of protocol. Here I have selected the Email protocol so SNS requests an email address.

Once an SNS Subscription is created it must be confirmed. Here my endpoint is an email address, so SNS sends this email:

When the owner of the email confirms the subscription, a new window opens displaying the Subscription ID:

I then create further subscriptions for each SNS Topic. The SNS Subscription dashboard updates to show the list of endpoints and the confirmation status of each:

Note that signin-console-success-root has two subscriptions – one email and one SMS. This is because I never use my root account and want the heightened awareness of an SMS!

In terms of cost, the first thousand email notifications SNS every month are included in the AWS Always Free tier. Any costs will be from the infrequent SMS notifications.

With the alerts created, let’s start on the events they’ll alert against.

CloudTrail

AWS CloudTrail records user activity and API interactions. These include resource creation, service configuration and, crucially, sign-in activity.

By default, CloudTrail holds 90 days of events that can be viewed, searched and downloaded from the CloudTrail dashboard. A CloudTrail Trail is needed to store events for longer periods or to export them to other AWS services.

CloudTrail Trails

Here my CoudTrail Trail will be delivering events from CloudTrail to CloudWatch for analysis and storing them in an S3 bucket. I use the AWS CloudTrail documentation to create an events-management trail based in eu-west-1:

This trail is included in the AWS Always Free tier as it is my only one and it only records management events. There will be S3 charges for the objects in the bucket but this is usually around 30kb a day, so the cost here is trivial.

CloudTrail Logs

While I’m talking about CloudTrail, let’s look at the log events themselves. The CloudTrail user guide has some examples so let’s take examine one.

This example log event shows that the IAM user Alice used the AWS CLI to create a new user named Bob.

{"Records": [{
    "eventVersion": "1.0",
    "userIdentity": {
        "type": "IAMUser",
        "principalId": "EX_PRINCIPAL_ID",
        "arn": "arn:aws:iam::123456789012:user/Alice",
        "accountId": "123456789012",
        "accessKeyId": "EXAMPLE_KEY_ID",
        "userName": "Alice"
    },
    "eventTime": "2014-03-24T21:11:59Z",
    "eventSource": "iam.amazonaws.com",
    "eventName": "CreateUser",
    "awsRegion": "us-east-2",
    "sourceIPAddress": "127.0.0.1",
    "userAgent": "aws-cli/1.3.2 Python/2.7.5 Windows/7",
    "requestParameters": {"userName": "Bob"},
    "responseElements": {"user": {
        "createDate": "Mar 24, 2014 9:11:59 PM",
        "userName": "Bob",
        "arn": "arn:aws:iam::123456789012:user/Bob",
        "path": "/",
        "userId": "EXAMPLEUSERID"
    }}
}]}

Let’s break this down. The first section of the log tells us about Alice:

    "userIdentity": {
        "type": "IAMUser",
        "principalId": "EX_PRINCIPAL_ID",
        "arn": "arn:aws:iam::123456789012:user/Alice",
        "accountId": "123456789012",
        "accessKeyId": "EXAMPLE_KEY_ID",
        "userName": "Alice"

Her userName is Alice, she is an IAMUser and her accountId is 123456789012. The next part tells us what happened:

    "eventTime": "2014-03-24T21:11:59Z",
    "eventSource": "iam.amazonaws.com",
    "eventName": "CreateUser",
    "awsRegion": "us-east-2",
    "sourceIPAddress": "127.0.0.1",
    "userAgent": "aws-cli/1.3.2 Python/2.7.5 Windows/7"

At 21:11 on 24/03/2014 Alice used the AWS CLI to call iam.amazonaws.com‘s CreateUser action. Alice’s IP address was 127.0.0.1 and she was using us-east-2.

Finally the log shows the parameters Alice supplied:

    "requestParameters": {"userName": "Bob"},
    "responseElements": {"user": {
        "createDate": "Mar 24, 2014 9:11:59 PM",
        "userName": "Bob",
        "arn": "arn:aws:iam::123456789012:user/Bob"

Alice provided a userName of Bob, and AWS responded with a createDate and arn for the new user.

Armed with the knowledge of what an event looks like, let’s start analysing some of them!

CloudWatch

Amazon CloudWatch is a service for monitoring, analysing and observing events. CloudWatch has several features for various situations – I’ll be using the following features for my security alerts:

  • Log Groups – collections of streams of events coming from the same source.
  • Metric Filters – filter expressions that are applied to events to create data points for CloudWatch metrics.
  • Alarms – rules that watch CloudWatch metrics and perform actions based on their values.

Let’s start with a log group.

CloudWatch Log Group

As this is a new Log Group, I can configure it from the CloudTrail console by editing the existing events-management trail.

Nothing too complex here. The Log Group needs a name – aws-cloudtrail-logs-signin-console. It also needs an IAM role. This is essential otherwise CloudTrail can’t send the events to CloudWatch. In these situations the console usually offers to create a new role, which I call CloudTrail-CloudWatchLogs-Signin-Console.

That’s it! Now that CloudWatch is receiving the logs it needs to know what to look for.

CloudWatch Metric Filters

The Metric Filters are going to look at events in the Log Group and use them to create data points for my alarms. There are two steps to creating a metric filter:

  • A pattern must be defined for the filter.
  • A metric must be assigned to the filter.

Defining A Pattern

CloudWatch needs to know the terms and/or patterns to look for in the Log Group. This is done by specifying a filter pattern, for which there is an AWS user guide about filter and pattern syntax.

For the signin-console-failure-iam alert, the filter will be:

{ $.eventSource = "signin.amazonaws.com" && $.eventName = "ConsoleLogin" && $.responseElements.ConsoleLogin = "Failure" && $.userIdentity.type = "IAMUser" }

To break this down:

For limiting events to sign-ins I use $.eventSource = "signin.amazonaws.com". This will be the same for all filters.

I only want to know about AWS console logins so I add $.eventName = "ConsoleLogin". This will also be the same for all filters.

This filter only cares about failed events, so I need to add $.responseElements.ConsoleLogin = "Failure". This will change to "Success" for other filters.

Finally I want to limit this filter to IAM users, and so add $.userIdentity.type = "IAMUser". This will change to "root" for other filters.

To aid understanding, this will be the filter for the signin-console-success-root alert:

{ $.eventSource = "signin.amazonaws.com" && $.eventName = "ConsoleLogin" && $.responseElements.ConsoleLogin = "Success" && $.userIdentity.type = "root" }

Assigning A Metric

CloudWatch now needs to know about the metrics to create. First it needs a name for the new filter, one for the metric itself and one for the namespace that will contain the metric.

Then I need to make some decisions about the metric values, which I set as follows:

Nothing elaborate here – the metric will be one every time a matching event is found and zero otherwise. I originally left the default value blank but this led to some undesirable alarm behaviour, which I will go into later.

Speaking of alarms…

CloudWatch Alarms

At this point CloudWatch understands what I’m looking for but has no way to tell me if it finds anything. The alarms will provide that missing link!

Creating an alarm starts by selecting one of the new metrics and choosing how often CloudWatch will check it. Then I set the conditions the alarm will use:

Here I want the alarm to trigger when the metric is greater than zero.

CloudWatch now needs to know what actions it must perform when an alarm triggers. CloudWatch alarms have three states:

  • OK (Green) – The metric or expression is within the defined threshold
  • In Alarm (Red) – The metric or expression is outside of the defined threshold.
  • Insufficient Data (Grey) – The alarm has just started, the metric is not available, or not enough data is available for the metric to determine the alarm state.

Here I tell CloudWatch to notify the signin-console-failure-iam SNS Topic when the corresponding metric is outside of the defined threshold of zero and enters the In Alarm state.

This is why I created the SNS resources first. It makes CloudWatch alarm creation a lot smoother.

Three additional alarms later I’m all done! As AWS provide ten custom metrics and ten alarms in the Always Free tier, my new CloudWatch setup will be free.

Insufficient Data (Grey) Alarms

Before moving on, let’s talk about grey alarms for a moment.

While grey alarms generally aren’t a problem in CloudWatch, they don’t look great from a human perspective. While green suggests everything’s fine and red suggests problems, grey is more vague. Everything could be ok. There might be problems. Not ideal.

This is why I set my default metric values to zero in the Metric Filters section. When no default value was set, CloudWatch considered the data to be missing and set the alarm state to Insufficient Data unless it was alerting. While this isn’t a problem, the DBA in me will always prefer green states to grey ones!

During an alarm’s configuration, it is possible to change the treatment of missing data:

I did try this out and it did work as expected – the grey alarm turned green when told to treat missing data as good. But this would mean that any missing data would be treated as good. That setting did not fill me with reassurance for this use case!

Does This All Work?

Let’s find out! I have four CloudWatch alarms, each partnered with a different SNS topic. This should mean I get a different notification for each type of event when the alarms trigger.

Here is my CloudWatch Alarms dashboard in its base state with no alarms triggered.

This is the same dashboard with all alarms triggered.

Failing to sign in as an IAM user triggered this email:

While a successful IAM sign-in triggered this one:

Failing to sign in as the root user triggered this email:

And a successful root sign in triggered this email:

And this SMS:

Cost Analysis

The eagle-eyed will have noticed that some of the dates in these screenshots are from early February. I was going to publish this post around that time too, but I wanted to finish my T-SQL Tuesday post first and then had a busy week.

This means I can demonstrate the actual costs of my security alerts though!

These AWS Billing screenshots are from 2022-02-13, so a week after the earlier screenshots. Be aware that, as IAM is always free, it has no entry on the bill.

First of all, CloudTrail and CloudWatch:

As expected, well within the AWS Always Free tier limits and no charges. Next is SNS:

The cost here is for SMS notifications. I’ve triggered two in testing so that’s averaging 0.04 USD each. This cost is acceptable considering the peace of mind it gives – these are the notifications for the successful root account sign-ins!

Summery

In this post I’ve demonstrated how a number of AWS managed services work together to turn a collection of events into meaningful security alerts that give me peace of mind when I’m signed out of my AWS account. I’ve also analysed the costs of my setup and have used various AWS Always Free tier offerings to minimise the impact on my monthly AWS bill.

If this post has been useful, please feel free to follow me on the following platforms for future updates:

Thanks for reading ~~^~~