In this post, I build my event-based AWS Glue automated cost control process using serverless managed services.
Table of Contents
Introduction
Last time, I examined some unexpected AWS Glue costs and designed an event-based cost control process architecture. I also wrote this user story:
As an AWS account owner, I want Glue interactive sessions to stop automatically after a chosen duration so that I don’t accidentally generate unexpected and avoidable costs.
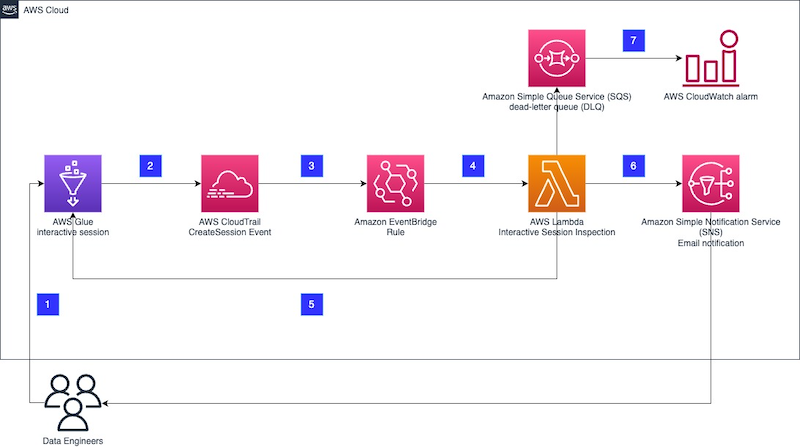
Here, I’m going to build my event-based Glue cost control process using these AWS services:
- SNS
- CloudTrail
- Step Functions
- EventBridge
- CloudWatch
The order is based on dependencies, which I will explain shortly. Some of these resources already exist, so let’s start by reviewing those.
Existing Resources
I have two existing SNS topics that this process will use. These are general-purpose topics used for all my Step Functions notifications. They are:
failure-stepfunctionsuccess-stepfunction
Both topics are largely alike, with the main difference being the distinct subaddressing in their respective email endpoints.
CloudTrail
Let’s start by examining an AWS Glue CreateSession CloudTrail event record. I haven’t included a full Glue CreateSession CloudTrail event record here because:
- They’re around 90 lines long. Each.
- They contain sensitive data.
The AWS documentation covers CloudTrail record contents in full for those curious.
Here’s part of a Glue CreateSession CloudTrail event record. This one shows session glue-studio-datapreview-e09f88a9-4d7f-4e64-95f2-e435fbd1963a:
{
    "eventSource": "glue.amazonaws.com",
    "eventName": "CreateSession",
    "requestParameters": {
        "id": "glue-studio-datapreview-e09f88a9-4d7f-4e64-95f2-e435fbd1963a",
        "command": {
            "name": "glueetl",
            "pythonVersion": "3"
        },
        "idleTimeout": 30,
        "maxCapacity": 2,
        "glueVersion": "4.0",
        "requestOrigin": "GlueStudioDataPreview"
    },
}
Here, requestParameters contains the new session’s details including its ID:
{
    "eventSource": "glue.amazonaws.com",
    "eventName": "CreateSession",
    "requestParameters": {
        "id": "glue-studio-datapreview-e09f88a9-4d7f-4e64-95f2-e435fbd1963a",
        "command": {
            "name": "glueetl",
            "pythonVersion": "3"
        },
        "idleTimeout": 30,
        "maxCapacity": 2,
        "glueVersion": "4.0",
        "requestOrigin": "GlueStudioDataPreview"
    },
}
This is the Glue Interactive Session’s unique identifier. I’ll be using this in my event-based Glue cost control build shortly. For now, understand that:
- The Glue Interactive Session’s ID is found in the event record’s
requestParametersobject. - The
requestParametersobject is in turn found in the event record’sdetailsobject.
This is represented as:
detail.requestParameters.idI’m going to pass this ID to a Step Functions state machine later. Speaking of which…
Step Functions
In this section, I start creating my event-based Glue cost control build automation. This consists of two components:
- An event router – built with an EventBridge rule.
- A service orchestrator – built with a Step Functions state machine.
Since the state machine will be the EventBridge rule’s target, I must create the state machine first.
State Machine Actions
The state machine’s architecture was covered in my previous post. As a reminder, when given a Glue SessionID the state machine must:
- Wait for a set period.
- Stop the Glue session.
- Trigger a confirmation email.
So let’s run through each step, starting with how the Glue SessionID is acquired.
Getting Glue Session ID
When executing a Step Functions state machine, an optional JSON input can be specified. There are several ways to supply this input:
- AWS CLI
start-executioncommand‘s--inputparameter - AWS SDK
StartExecutionAPI‘sinputparameter - Step Functions console’s Start Execution
Inputfield:
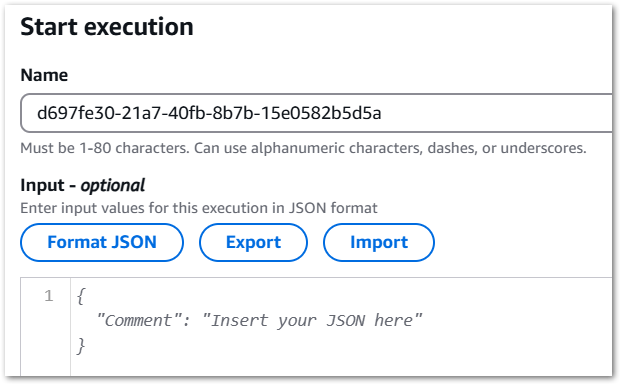
For my event-based Glue cost control build, a typical JSON input will be:
{
  "session_id": "glue-studio-datapreview-123-456-789"
}
This can then be used in the other states as "$.session_id"
The state machine must then enter a wait state.
Wait
Step Functions has a built-in Wait state for handling delays. I want a thirty-second delay. This is configurable both in Workflow Studio and Amazon States Language (ASL):
    "Wait": {
      "Type": "Wait",
      "Seconds": 30,
      "Next": "StopGlueSession"
    },
The state machine must then stop the Glue session.
Glue: Stop Session
To understand what’s needed here, let’s review the Glue StopSession API reference. ID is the only required parameter, which comes from the earlier JSON input.
This is represented in ASL as:
{
  "Id.$": "$.session_id"
}
Now, as discussed previously, this action can fail. In the example below, a Glue StopSession request fails because the session is still being provisioned. Since nothing has started, there is nothing to stop:
{
  "cause": "Session is in PROVISIONING status (Service: Glue, Status Code: 400, Request ID: null)",
  "error": "Glue.IllegalSessionStateException",
  "resource": "stopSession",
  "resourceType": "aws-sdk:glue"
}
To that end, I’ve added retry parameters. Upon error, StopGlueSession will retry three times, with a ten-second delay between attempts. If the third retry fails, then the state machine’s error handling will be invoked.
This is the state’s ASL:
    "StopGlueSession": {
      "Type": "Task",
      "Resource": "arn:aws:states:::aws-sdk:glue:stopSession",
      "Parameters": {
        "Id.$": "$.session_id"
      },
      "Next": "SNS Publish",
      "Retry": [
        {
          "ErrorEquals": [
            "States.ALL"
          ],
          "IntervalSeconds": 10,
          "MaxAttempts": 3
        }
      ]
    },
Where:
"Id.$": "$.session_id"is the GlueSessionIDfrom the JSON input."ErrorEquals": ["States.ALL"]captures all errors."IntervalSeconds": 10, "MaxAttempts": 3sets the retry parameters.
Finally, the state machine must trigger a confirmation email.
SNS: Publish
I usually avoid state machine success notifications to avoid alarm fatigue, but I decided to include them here for two reasons:
- I can check the state machine is working without accessing AWS.
- I can see excessive activity without viewing logs.
Here, I publish a message to my existing success-stepfunction SNS topic using SNS’s optimised integration:
"SNS Publish": {
      "Type": "Task",
      "Resource": "arn:aws:states:::sns:publish",
      "Parameters": {
        "TopicArn": "arn:aws:sns:eu-west-1:[REDACTED]:success-stepfunction",
        "Message.$": "States.Format('Hi! AWS Step Functions has stopped this Glue session for you: {}', $)"
      },
      "End": true
    }
I customised the Message.$ parameter using the States.Format intrinsic function:
- The string starting with
'Hi!...is the message I want SNS to use. {}is a placeholder for the value I want to insert.$is the state machine data to insert into{}
This produces a better email notification for the user:
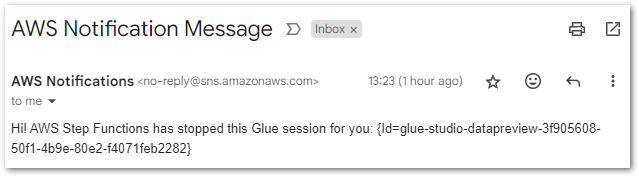
Hi! AWS Step Functions has stopped this Glue session for you: {Id=glue-studio-datapreview-3f905608-50f1-4b9e-80e2-f4071feb2282}Finally, "End": true stops the state machine.
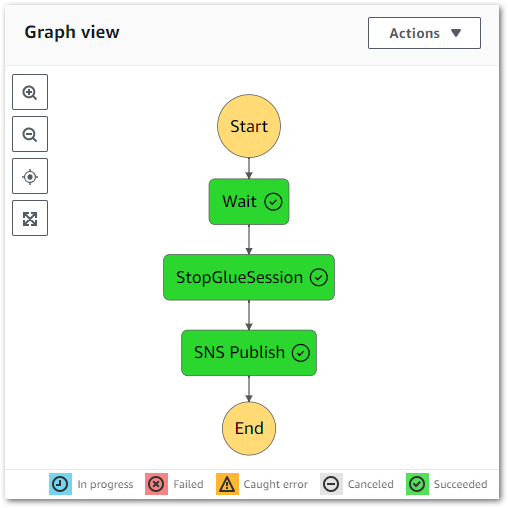
Final Workflow
The state machine is now as follows:
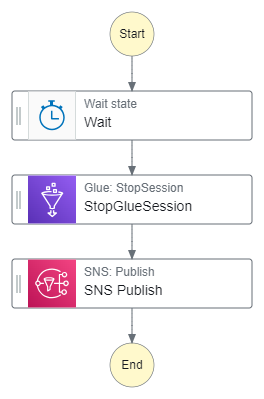
With this auto-generated ASL:
{
  "StartAt": "Wait",
  "States": {
    "Wait": {
      "Type": "Wait",
      "Seconds": 30,
      "Next": "StopGlueSession"
    },
    "StopGlueSession": {
      "Type": "Task",
      "Resource": "arn:aws:states:::aws-sdk:glue:stopSession",
      "Parameters": {
        "Id.$": "$.session_id"
      },
      "Next": "SNS Publish",
      "Retry": [
        {
          "ErrorEquals": [
            "States.ALL"
          ],
          "IntervalSeconds": 10,
          "MaxAttempts": 3
        }
      ]
    },
    "SNS Publish": {
      "Type": "Task",
      "Resource": "arn:aws:states:::sns:publish",
      "Parameters": {
        "TopicArn": "arn:aws:sns:eu-west-1:[REDACTED]:success-stepfunction",
        "Message.$": "States.Format('Hi! AWS Step Functions has stopped this Glue session for you: {}', $)"
      },
      "End": true
    }
  },
  "Comment": "When given a Glue SessionID start a wait, stop the session and send an SNS message."
}
There’s one more aspect to sort out. What happens if the state machine fails?
Error Logging
Firstly, let’s examine the state of events if the state machine fails:
- A Glue session must have started.
- An Eventbridge Rule must have sent the event to Step Functions.
- One of the state machine states must have failed.
Unless the failing state is SNS:Publish, then there is an active Glue session still incurring costs. Therefore, triggering an alarm is much more appropriate than a notification. Alarm creation requires sending the state machine logs to CloudWatch.
By default, new state machines do not enable logging due to storage expenses. However, in this case, the log storage cost will be significantly lower than that of an unattended Glue Session. So I activate the logging for my state machine.
Step Functions log levels range from ALL to ERROR to FATAL to OFF, which are explained in the AWS documentation. As I’m only interested in failures, I select ERROR and include the execution data. This consists of execution input, data passed between states and execution output:
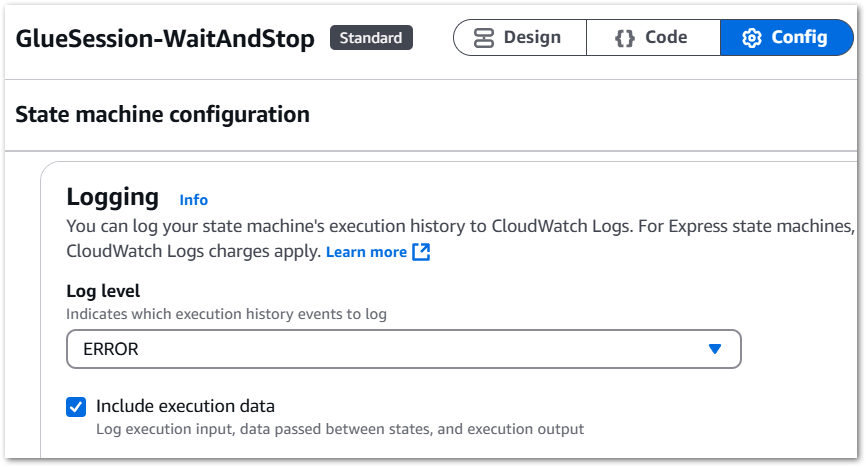
Next, I create a new CloudWatch log group called /aws/vendedlogs/states/GlueSession-WaitAndStop-Logs. This will form the basis of my failure alerting.
CloudWatch
Here, I configure the CloudWatch resources for my event-based Glue cost control build.
Log Groups & Metrics
The previously configured GlueSession-WaitAndStop-Logs group receives all the Step Functions state machine’s ERROR events. In most cases, these are Glue.IllegalSessionStateException events:
{
    "id": "7",
    "type": "TaskFailed",
    "details": {
        "cause": "Session is in PROVISIONING status (Service: Glue, Status Code: 400, Request ID: b1baaf14-ae89-4106-a286-87cf5445de6c)",
        "error": "Glue.IllegalSessionStateException",
        "resource": "stopSession",
        "resourceType": "aws-sdk:glue"
    },
Note the TaskFailed event type – it indicates the failure of a single state, not the entire state machine. Thus, I don’t need alerts for those events.
However, there are also ExecutionFailed events like these:
{
    "id": "5",
    "type": "ExecutionFailed",
    "details": {
        "cause": "An error occurred while executing the state 'StopGlueSession' (entered at the event id #4). The JSONPath '$.session_id' specified for the field 'Id.$' could not be found in the input '{\n  \"sessionId\": \"\"\n}'",
        "error": "States.Runtime"
    },
I definitely want to know about these! ExecutionFailed means the entire state machine failed, and there’s probably a Glue Session still running!
These events are captured as ExecutionsFailed CloudWatch metrics. Keep in mind that the AWS Step Functions console automatically publishes various metrics irrespective of logging configurations, including ExecutionFailed. However, in my experience, having both the metrics and failure logs centralised in CloudWatch simplifies troubleshooting.
Next, let’s use these metrics to create an alarm.
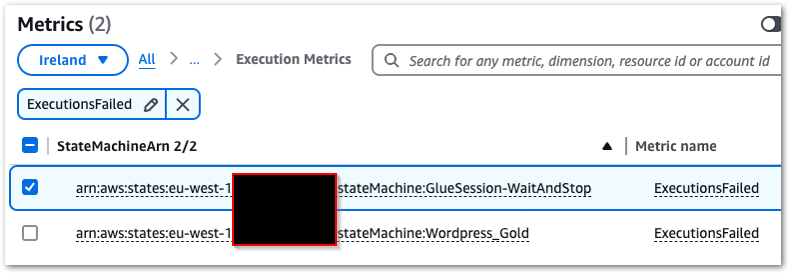
Alarm
Creating a CloudWatch alarm begins with selecting the ExecutionsFailed metric from States > Execution Metrics
This alarm will have a static value threshold with a value greater than zero, which is checked every minute. When the alarm’s state is In Alarm, an email notification will be sent to my failure-stepfunction SNS topic.
Finally, CloudWatch creates a new alarm graph:
So that’s everything state machine needs. Next, how do I pass the Glue SessionID to it?
EventBridge
In this section, I create the EventBridge Rule responsible for handling my event-based Glue cost control build’s events.
EventBridge Rule Anatomy
EventBridge Rules specify the criteria for routing events from an event bus to designated targets like Lambda functions, Step Functions and SQS queues. They use event patterns to filter incoming events and identify targets to route to, enabling event-driven and event-based workflows without custom processing logic.
Creating an EventBridge Rule involves three steps:
- Define rule detail
- Build event pattern
- Select target
Define Rule Detail
Besides the name and description, this section is mainly concerned with:
- Event Bus: The event bus to monitor for events.
Defaultis fine. - Rule Type: EventBridge’s rule type. This can either match an event pattern or operate on a schedule (this is different from EventBridge Scheduler – Ed).
Next, let’s discuss event patterns!
Build Event Pattern
Firstly, event patterns are a very expansive topic, so please refer to the EventBridge user guide afterwards for definitions and examples.
Event patterns act as filters, defining how EventBridge identifies whether to send an event to a target. The EventBridge console provides options for sample events and testing patterns.
As a reminder, this is part of a typical CreateSession event record from which I want to capture ID:
"eventSource": "glue.amazonaws.com",
"eventName": "CreateSession",
"requestParameters": {
  "id": "glue-studio-datapreview-3f905608-50f1-4b9e-80e2-f4071feb2282",
  "role": "arn:aws:iam::[REDACTED]:role/service-role/AWSGlueServiceRole-wordpress_bronze",
        "command": {
            "name": "glueetl",
            "pythonVersion": "3"
        },
        "idleTimeout": 30
....
EventBridge currently has three pattern creation methods:
- Schema: Using either manual entry or the schema registry.
- Pattern Form: Using pre-defined EventBridge templates.
- Custom Pattern: Using a manual JSON editor.
Pattern Form offers a series of dropdowns that quickly construct the desired pattern:
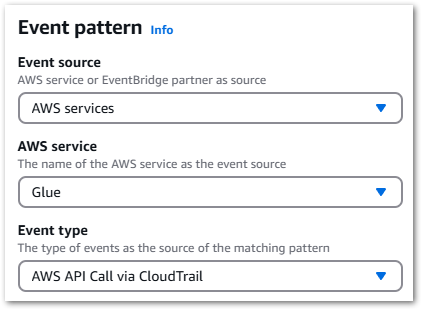
Selecting AWS Services > Glue > AWS API Call via CloudTrail creates this event pattern:
{
  "source": ["aws.glue"],
  "detail-type": ["AWS API Call via CloudTrail"],
  "detail": {
    "eventSource": ["glue.amazonaws.com"]
  }
}
This will send all Glue events to the target, so it could use some refinement. An eventName can be added to the pattern either by manual editing or via the Specific Operation(s) setting.
The updated pattern will now only send Glue CreateSession events:
{
  "source": ["aws.glue"],
  "detail-type": ["AWS API Call via CloudTrail"],
  "detail": {
    "eventSource": ["glue.amazonaws.com"],
    "eventName": ["CreateSession"]
  }
}
Select Target
Finally, I must select the EventBridge Rule’s target – my state machine. This is why I created the state machine first; for it to be an EventBridge target it must first exist.
At this point, I could pass the whole event to the state machine. However, the state machine had no way to parse the SessionID from the event. While JSONata could now meet this requirement, it wasn’t a Step Functions feature back in June.
Luckily, EventBridge offers relevant settings here. One of these – an Input Transformer – can customise an event’s text before EventBridge sends it to the rule’s target. Input Transformers consist of an Input Path and Input Template.
An Input Path uses a JSON path and key-value pairs to reference items in events and store them as variables. For instance, capturing ID from this event:
"eventSource": "glue.amazonaws.com",
"eventName": "CreateSession",
"requestParameters": {
  "id": "glue-studio-datapreview-3f905608-50f1-4b9e-80e2-f4071feb2282",
  "role": "arn:aws:iam::[REDACTED]:role/service-role/AWSGlueServiceRole-wordpress_bronze",
        "command": {
            "name": "glueetl",
            "pythonVersion": "3"
        },
        "idleTimeout": 30
....
Requires this Input Path:
{
  "id": "$.detail.requestParameters.id"
}
In which:
$.detailaccesses thedetailobject of the CloudTrail event record.$.detail.requestParametersaccesses therequestParametersobject withindetail.- Finally,
$.detail.requestParameters.idaccesses theidvalue withinrequestParameters.
This is passed to an Input Template, mapping the path’s output to a templated key-value pair. This is then passed to the rule target verbatim, replacing placeholders with the Input Path values.
So this template:
{
  "session_id": "<id>"
}
Produces a JSON object comprising a "session_id": string and the Input Path’s Glue SessionID value:
{
  "session_id": "glue-studio-datapreview-3f905608-50f1-4b9e-80e2-f4071feb2282"
}
This will be passed as the JSON input when executing the state machine.
That’s everything done now. So let’s see if it works!
Testing
This section tests my event-based Glue cost control build.
In the following tests, a Glue Interactive Session was started with the build fully active and was observed in the AWS console. AWS assigned the SessionID glue-studio-datapreview-3f905608-50f1-4b9e-80e2-f4071feb2282.
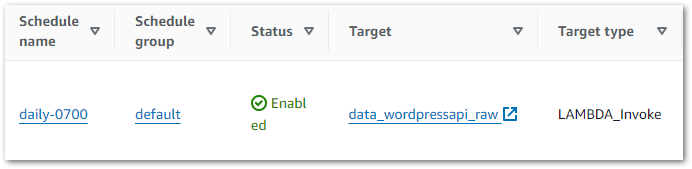
EventBridge Rule
Expectation: When a Glue CreateSession CloudTrail event record is created:
- EventBridge matches the CloudTrail event record to my EventBridge Rule.
- The EventBridge Rule triggers and defines a
session_idvariable. - The EventBridge Rule executes my target state machine with
session_idJSON input.
Result: CloudWatch indicates EventBridge matched the CloudTrail Event Record to my EventBridge Rule’s Event Pattern, executing the intended actions:
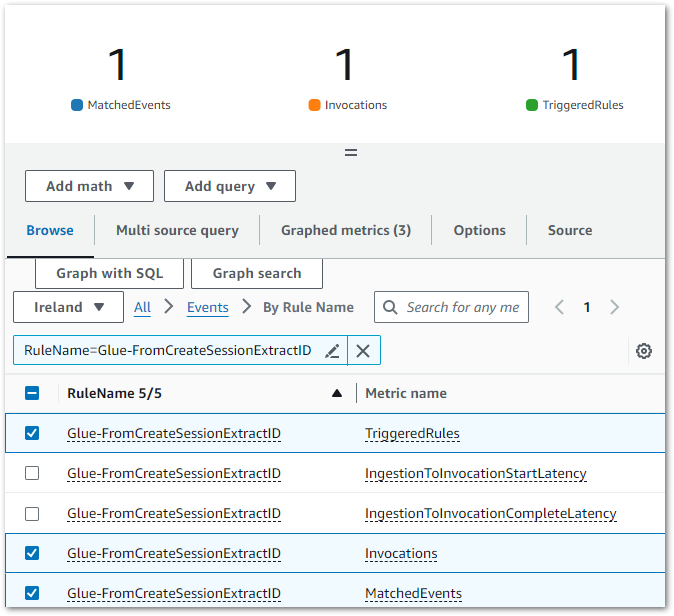
The EventBridge Rule’s extracts the glue-studio-datapreview-3f905608-50f1-4b9e-80e2-f4071feb2282 SessionID from the CloudTrail Event Record and adds it as a JSON input when executing the targeted GlueSession-WaitAndStop state machine.
Step Functions State Machine
Expectation: When a Glue CreateSession CloudTrail event record is created:
- State machine is executed with
session_idJSON input. - Glue
StopSessionAPI is called after 30 seconds. - If the first
StopSessionAPI call fails, a retry occurs after ten seconds. - A confirmation email is sent to the user.
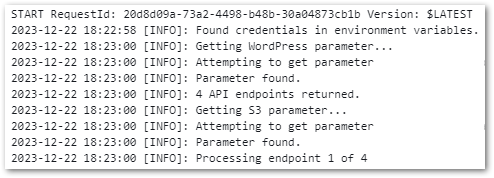
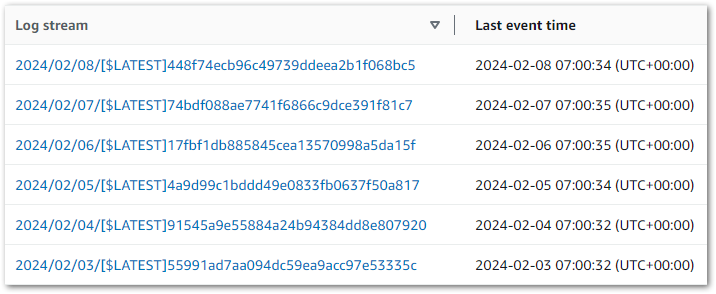
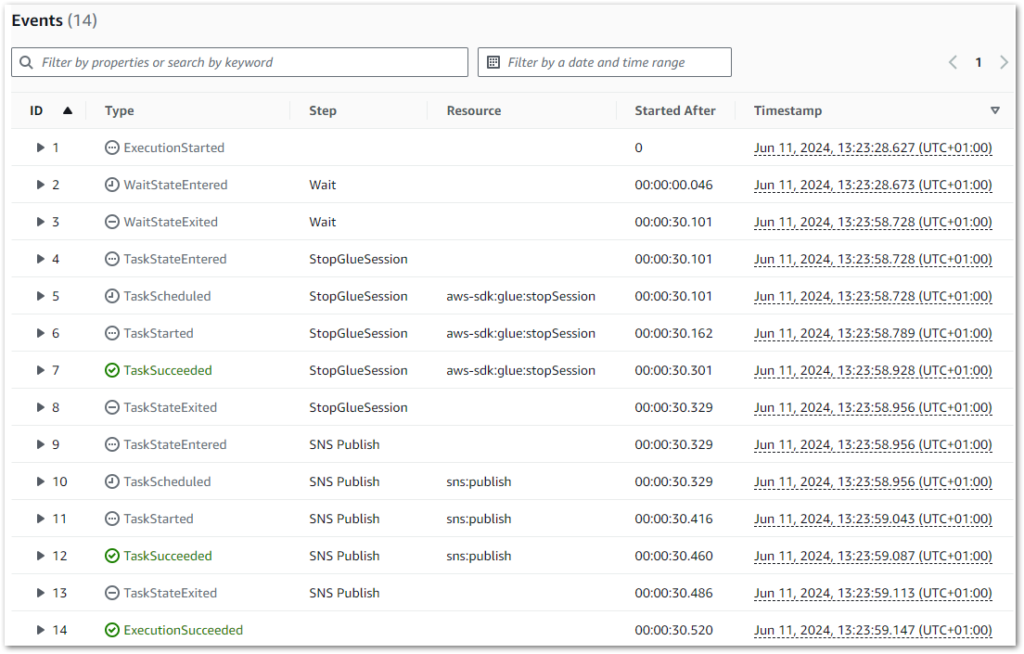
Result: State machine executes successfully:
The state machine logs also correctly show a thirty-second wait between rows 2 and 3 (the start and end of the Wait state):
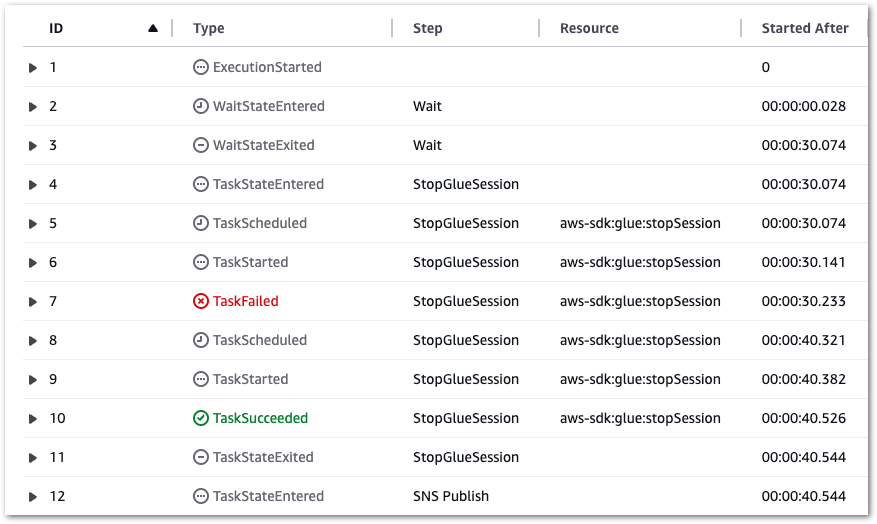
Additionally, if a Glue.IllegalSessionStateException error occurs, a retry occurs after ten seconds (see rows 7 and 8):
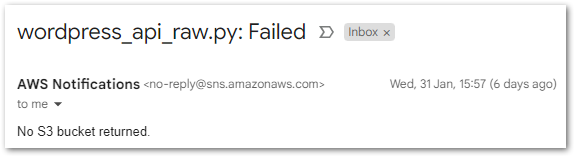
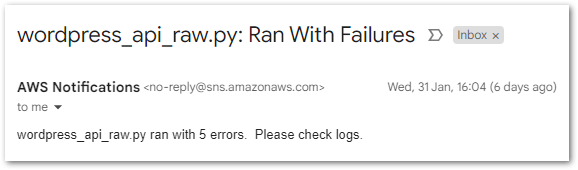
Finally, SNS sends the correct email to the user:
The failure alarm is tested later.
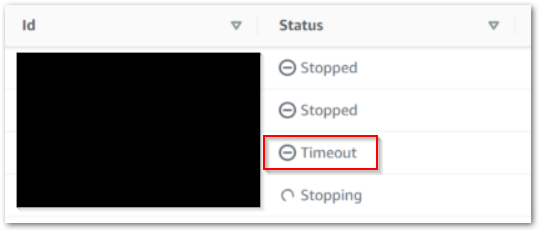
Glue Session
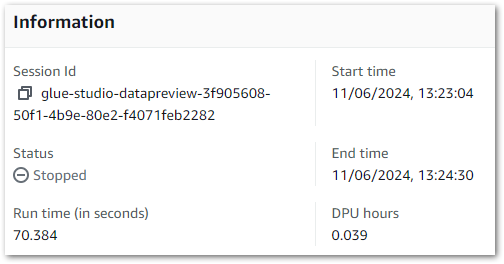
Expectation: When an Interactive Session starts while the EventBridge Rule is enabled, it is automatically stopped thirty seconds after becoming active.
Result: This session runs for seventy seconds. Although this exceeds thirty seconds, keep in mind that the session needs to be provisioned before it can be stopped.
These results can also be verified using the Glue Get-Session AWS CLI command:
[cloudshell-user@ip-[REDACTED] ~]$ aws glue get-session --id glue-studio-datapreview-3f905608-50f1-4b9e-80e2-f4071feb2282

{
    "Session": {
        "Id": "glue-studio-datapreview-3f905608-50f1-4b9e-80e2-f4071feb2282",
        "CreatedOn": "2024-06-11T12:23:04.586000+00:00",
        "Status": "STOPPED",

	[REDACTED]

        "WorkerType": "G.1X",
        "CompletedOn": "2024-06-11T12:24:30.210000+00:00",
        "ExecutionTime": 70.384,
        "DPUSeconds": 140.768,
        "IdleTimeout": 30
    }
}
(END)
CloudWatch Alarm
The CloudWatch Alarm was tested by briefly changing the Step Function state machine’s IAM policy to deny the StopSession action and then starting a new Interactive Session, forcing the desired failure without altering the cost control process itself.
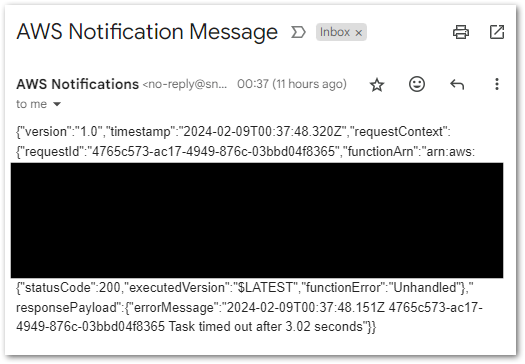
Expectation: If the state machine fails, then a CloudWatch Alert is sent to the user.
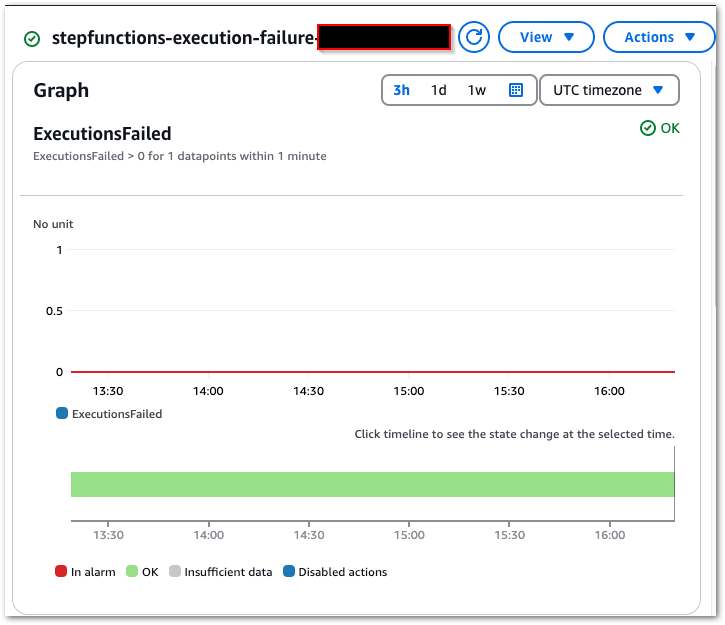
Result: Upon the state machine’s failure, an ExecutionsFailed metric is emitted to CloudWatch, shown in this chart:
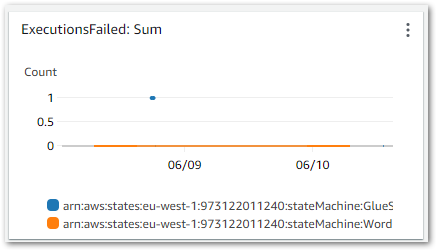
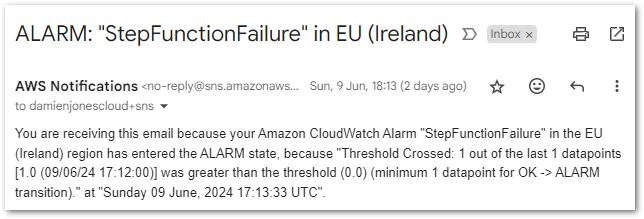
This triggers the CloudWatch Alarm when its Sum > 0 threshold condition is met, changing the alarm’s state to In Alarm and sending an email notification using my failure-stepfunction SNS topic:
And with that, all tests are successful. Now let’s look at the costs.
Cost Analysis
This section analyses the costs of my event-based Glue cost control build. There are two aspects to this:
- Cost Expenditure: How much is the cost control process costing me to run?
- Cost Savings: How much money am I saving on the stopped Glue Sessions?
Because the biggest test of all is whether this build satisfies the user story. Does it prevent unexpected and avoidable costs?
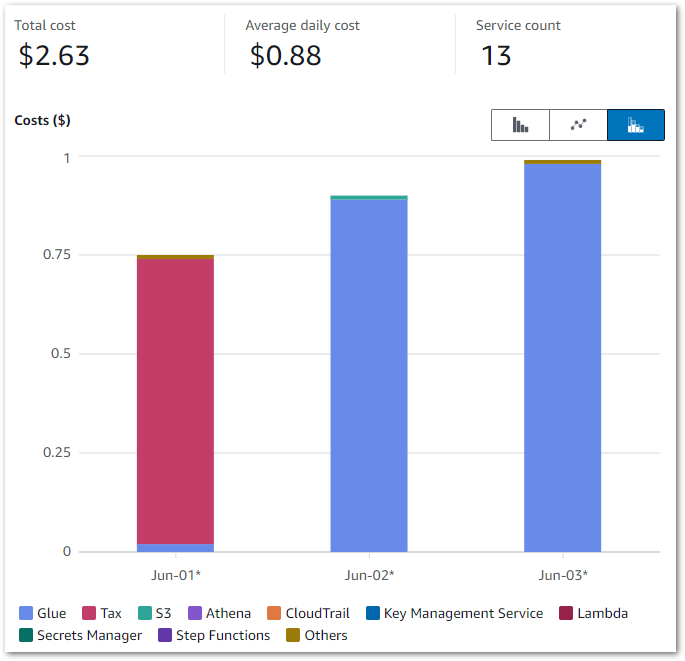
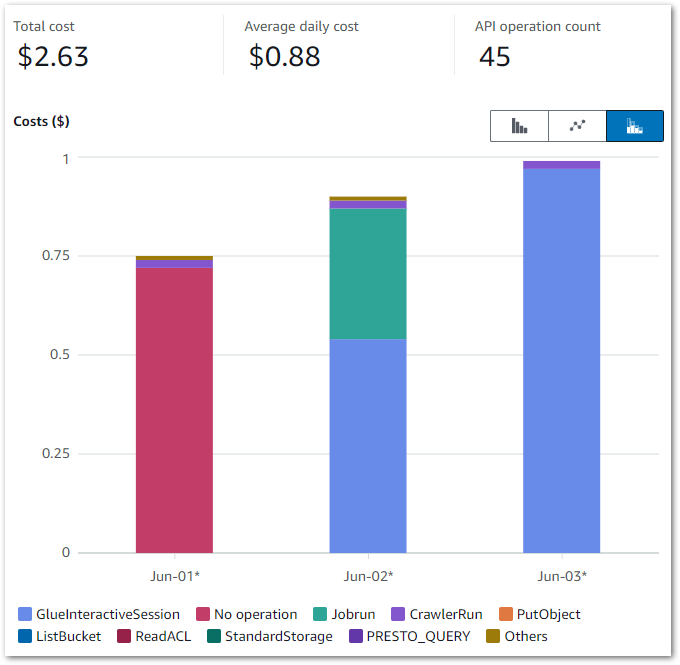
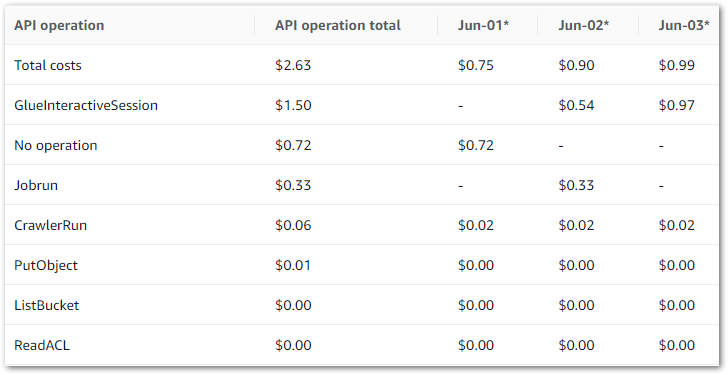
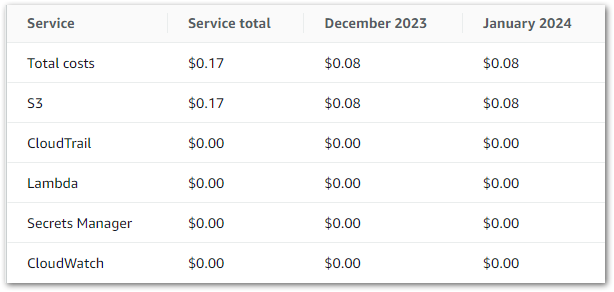
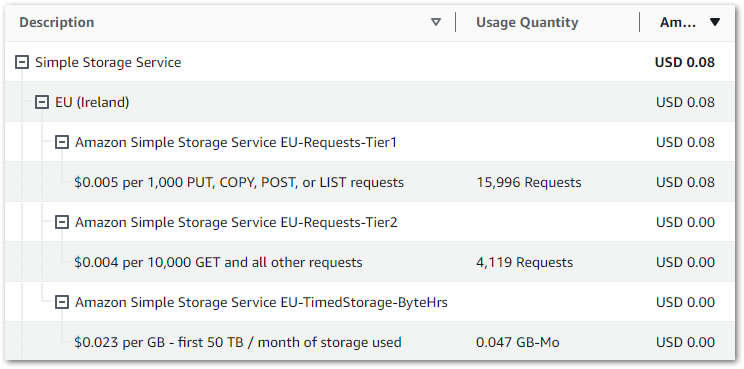
Cost Expenditure
Firstly, let’s examine my event-based Glue cost control build costs between June 2024 and November 2024:
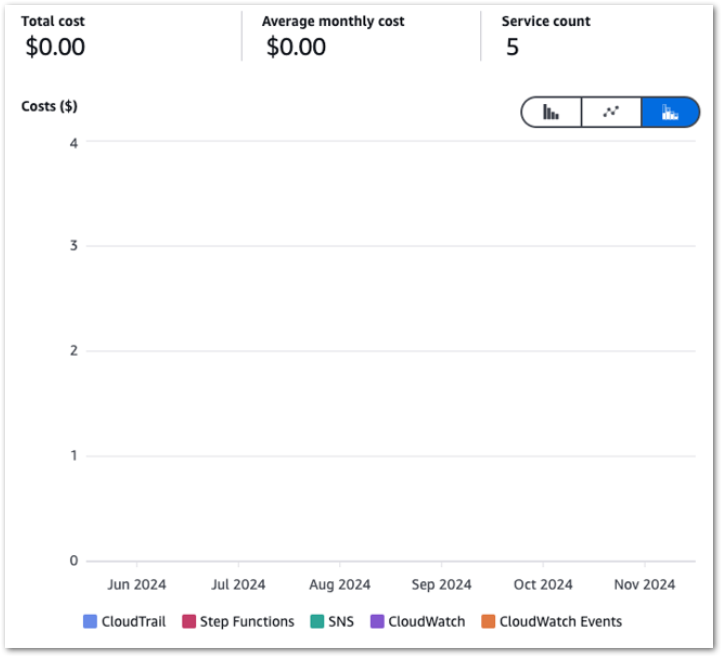
So I guess this kinda makes my point. Zero cost doesn’t mean zero usage though, so let’s check the bills for that period.
Caveat: I didn’t tag any of my resources (yes ok I know), so this usage is for the entire account.
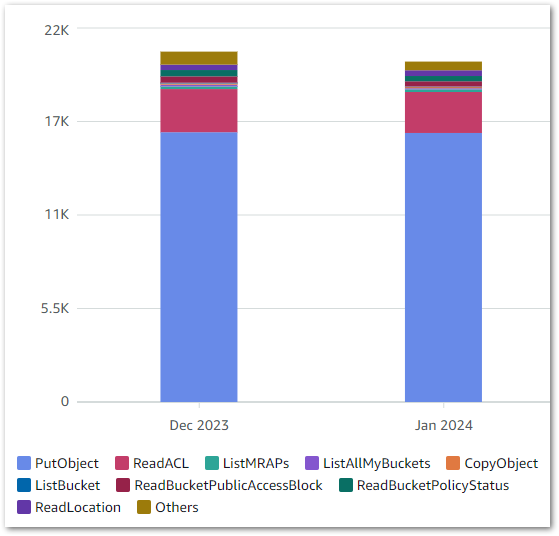
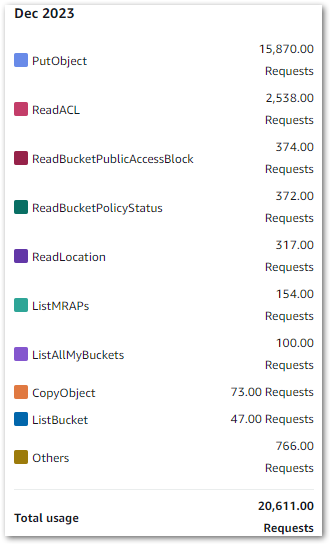
CloudTrail & CloudWatch Usage
CloudTrail FreeEventsRecorded:
| Service | Period | Metric | Quantity |
|---|---|---|---|
| CloudTrail | 2024-06 | FreeEventsRecorded | 33,217 |
| CloudTrail | 2024-07 | FreeEventsRecorded | 28,993 |
| CloudTrail | 2024-08 | FreeEventsRecorded | 40,682 |
| CloudTrail | 2024-09 | FreeEventsRecorded | 29,891 |
| CloudTrail | 2024-10 | FreeEventsRecorded | 36,208 |
| CloudTrail | 2024-11 | FreeEventsRecorded | 28,630 |
CloudWatch Alarms:
| Service | Period | Metric | Quantity |
|---|---|---|---|
| CloudWatch | 2024-06 | Alarms | 0.919 |
| CloudWatch | 2024-07 | Alarms | 2 |
| CloudWatch | 2024-08 | Alarms | 2.126 |
| CloudWatch | 2024-09 | Alarms | 2 |
| CloudWatch | 2024-10 | Alarms | 2 |
| CloudWatch | 2024-11 | Alarms | 2 |
CloudWatch Metrics:
| Service | Period | Metric | Quantity |
|---|---|---|---|
| CloudWatch | 2024-06 | Metrics | 5.29 |
| CloudWatch | 2024-07 | Metrics | 0.372 |
| CloudWatch | 2024-08 | Metrics | 4.766 |
| CloudWatch | 2024-09 | Metrics | 0.003 |
| CloudWatch | 2024-10 | Metrics | 4.003 |
| CloudWatch | 2024-11 | Metrics | 4.626 |
CloudWatch Requests:
| Service | Period | Metric | Quantity |
|---|---|---|---|
| CloudWatch | 2024-06 | Requests | 696 |
| CloudWatch | 2024-07 | Requests | 15 |
| CloudWatch | 2024-08 | Requests | 230 |
| CloudWatch | 2024-09 | Requests | 0 |
| CloudWatch | 2024-10 | Requests | 181 |
| CloudWatch | 2024-11 | Requests | 122 |
EventBridge, SNS & Step Functions Usage
EventBridge EventsInvocation:
| Service | Period | Metric | Quantity |
|---|---|---|---|
| EventBridge | 2024-06 | EventsInvocation | 30 |
| EventBridge | 2024-07 | EventsInvocation | 31 |
| EventBridge | 2024-08 | EventsInvocation | 31 |
| EventBridge | 2024-09 | EventsInvocation | 30 |
| EventBridge | 2024-10 | EventsInvocation | 31 |
| EventBridge | 2024-11 | EventsInvocation | 30 |
SNS NotificationDeliveryAttempts-SMTP:
| Service | Period | Metric | Quantity |
|---|---|---|---|
| SNS | 2024-06 | NotificationDeliveryAttempts-SMTP | 52 |
| SNS | 2024-07 | NotificationDeliveryAttempts-SMTP | 29 |
| SNS | 2024-08 | NotificationDeliveryAttempts-SMTP | 85 |
| SNS | 2024-09 | NotificationDeliveryAttempts-SMTP | 2 |
| SNS | 2024-10 | NotificationDeliveryAttempts-SMTP | 58 |
| SNS | 2024-11 | NotificationDeliveryAttempts-SMTP | 11 |
SNS Requests:
| Service | Period | Metric | Quantity |
|---|---|---|---|
| SNS | 2024-06 | Requests-Tier1 | 315 |
| SNS | 2024-07 | Requests-Tier1 | 542 |
| SNS | 2024-08 | Requests-Tier1 | 553 |
| SNS | 2024-09 | Requests-Tier1 | 325 |
| SNS | 2024-10 | Requests-Tier1 | 366 |
| SNS | 2024-11 | Requests-Tier1 | 299 |
Step Functions StateTransition:
| Service | Period | Metric | Quantity |
|---|---|---|---|
| Step Functions | 2024-06 | StateTransition | 388 |
| Step Functions | 2024-07 | StateTransition | 180 |
| Step Functions | 2024-08 | StateTransition | 566 |
| Step Functions | 2024-09 | StateTransition | 300 |
| Step Functions | 2024-10 | StateTransition | 616 |
| Step Functions | 2024-11 | StateTransition | 362 |
All within free tier. So how did Glue fare?
Cost Savings
Next, let’s pull my InteractiveSessions costs between June 2024 and November 2024:
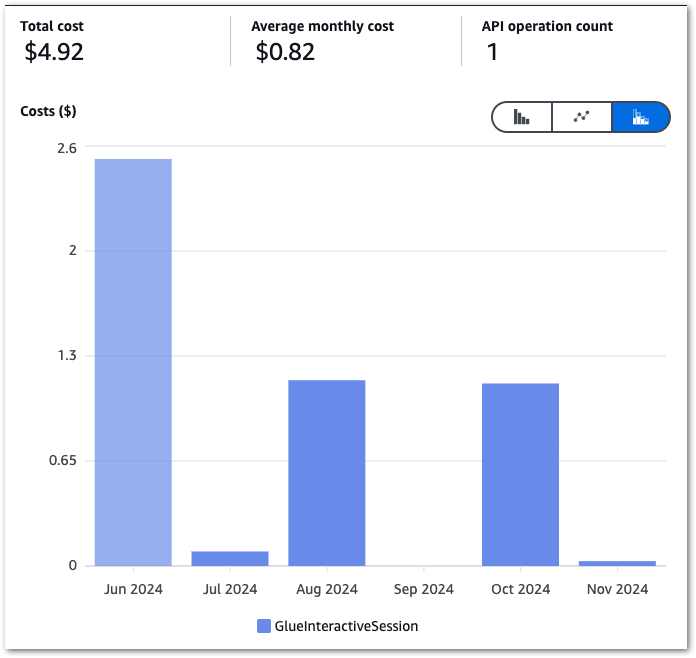
The high June costs kickstarted this process, and there’s a massive difference between June and the others! September isn’t a mistake – I was kinda busy.
Glue Costs
Here are the actual costs:
| Service | Period | Metric | Quantity | Cost $ |
|---|---|---|---|---|
| Glue | 2024-06 | InteractiveSessions | 5.731 DPU-Hour | 2.52 |
| Glue | 2024-07 | InteractiveSessions | 0.197 DPU-Hour | 0.09 |
| Glue | 2024-08 | InteractiveSessions | 2.615 DPU-Hour | 1.15 |
| Glue | 2024-09 | InteractiveSessions | 0.000 DPU-Hour | 0.00 |
| Glue | 2024-10 | InteractiveSessions | 2.567 DPU-Hour | 1.13 |
| Glue | 2024-11 | InteractiveSessions | 0.079 DPU-Hour | 0.03 |
| TOTAL | 4.92 |
While these aren’t exactly huge sums, there are two items to consider here:
- I try to keep my costs down in line with the Well Architectured Framework and The Frugal Architect.
- Proactive cost management is always better than reactive cost management. specially when it’s your bill!
Glue Estimated Savings
Finally, what saving does this represent? While I can’t get a value from AWS Billing, I can reasonably estimate one. Firstly, using the AWS Calculator for Glue I calculated the cost of an Interactive Session that times out:
2 DPUs x 0.50 hours x 0.44 USD per DPU-Hour = 0.44 USD
https://calculator.aws/#/createCalculator/Glue
Next, I went back through my records and found how many sessions had been stopped each month:
| Period | Stops |
|---|---|
| 2024-06 | 11 |
| 2024-07 | 5 |
| 2024-08 | 61 |
| 2024-09 | 0 |
| 2024-10 | 53 |
| 2024-11 | 2 |
Caveat: To be fair to AWS, some sessions were created while I was working on a Glue ETL job with automation enabled. So, while the automation was continually stopping sessions, I was constantly starting new ones. Thus, Glue isn’t the money pit I perhaps make out, and I’m not that careless with leaving them on!
By multiplying the number of stopped sessions by 0.44, I can determine each month’s potential cost, then subtract the actual cost to find the estimated savings:
| Period | Stops | Potential Cost $ | Actual Cost $ | Est. Saving $ |
|---|---|---|---|---|
| 2024-06 | 11 | 4.84 | 2.52 | 2.32 |
| 2024-07 | 5 | 2.20 | 0.09 | 2.11 |
| 2024-08 | 61 | 26.84 | 1.15 | 25.69 |
| 2024-09 | 0 | 0.00 | 0.00 | 0.00 |
| 2024-10 | 53 | 23.32 | 1.13 | 22.19 |
| 2024-11 | 2 | 0.88 | 0.03 | 0.85 |
| TOTAL | 132 | 58.08 | 4.92 | 53.16 |
Almost $55! Even if I reduce that by 50% based on the caveat, that’s still around a $25 saving. And with no setup costs!
Summary
In this post, I built my event-based AWS Glue automated cost control process using serverless managed services.
I’m pleased with the outcome! My generally busy Summer and Autumn inadvertently tested this process for six months, and it’s been fine throughout! I may soon extend the state machine’s waiting duration, which only needs a parameter change for one state.
The great thing about this process is that it isn’t limited to Glue; EventBridge can use nearly all AWS services as event sources. I’m seriously impressed with EventBridge. It’s poked me about Glacier restores, scheduled my ETLs and now is also saving me a few quid!
If this post has been useful then the button below has links for contact, socials, projects and sessions:

Thanks for reading ~~^~~