So I’m writing a different post instead. Many people examine how they earn cloud certifications, but few explore the reasons why. Here, I’ll share my attitudes and motivations toward earning and renewing a cloud certification, and how I apply my new knowledge after the fact.
Self Validation
For me, the biggest certification benefit is the confidence it gives me that I know what I’m talking about.
I’ve mentioned previously that I have anxiety and imposter syndrome issues. One way I approach that is to keep my technical knowledge current and relevant. This goes beyond the cloud. I have DataCamp and A Cloud Guru subscriptions for honing other areas, and various newsletters and feeds for news and opinions.
Certifications let me distil my knowledge into the recognised and understood forms of certification badges. These badges in turn give me the piece of mind that I can validate and evidence my cloud knowledge.
This doesn’t just benefit me…
Knowledge Validation
Having active cloud certifications gives my employer confidence that my cloud knowledge is accurate and reliable.
My employer uses many AWS services across various teams. My AWS certifications have given me T-shaped knowledge that helps me contribute to the success of both Data Engineering and the other tech teams. This knowledge lets me:
Troubleshoot Problems
Lambda function throwing unexpected exceptions? Slow running Athena query? Unreachable EC2 instance? I’ve solved all these problems using certification knowledge applied to real-world use.
For the record, the Lambda’s IAM role was missing actions, the S3 objects needed different partitioning and the instance was missing a security group.
Collaborate Across Teams
Whether preparing for failovers, replacing legacy packages with cloud processes or building APIs, I can work with my non-data colleagues by understanding the AWS services they use and what their outputs tell me.
For example, I don’t directly use AWS services like Systems Manager Patch Manager and API Gateway in my role. But I understand what those services are, what their outputs mean and how they relate to the services I do directly use.
Architect Agile Solutions
When faced with a new requirement or unexpected bug, I can call on my certification knowledge for optimal and appropriate solutions. Should those solutions turn out to be ineffective or undesirable, I can pivot or re-architect accordingly.
For example, when recently repartitioning an S3 bucket I approached the task using Python and boto3. During testing, it became clear this approach would take days to complete.
So I used my AWS CLI SysOps knowledge and refactored the Python code to script out the S3 CLI operations for each object. Then I completed the entire repartition in about two hours using Bash.
Same task. Same result. Different solutions.
Wider View
Studying for and passing certifications exposes me to cloud services I’ve never used, or don’t use often.
AWS constantly changes. Most weeks see new services, features or improvements. Keeping abreast of over two hundred services is difficult, and useful info will inevitably slip through the cracks.
Cloud certifications give me a wider view of the cloud landscape. While I’m primarily a data professional, knowing about services outside that scope improves my diversity and value. It also helps me manage my own cloud accounts. While I’m not responsible for my employer’s security or networking, I am responsible for mine!
Some recent useful discoveries from my SysOps renewal include:
EventBridge Pipes
From Amazon EventBridge’s Product page:
Amazon EventBridge Pipes helps create point-to-point integrations between event producers and consumers with optional transform, filter and enrich steps. EventBridge Pipes reduces the amount of integration code needed to write and maintain when building event-driven applications.
For me, EventBridge Pipes feels like ETL for events. It sits between event sources and event targets, removing unneeded data and transforming what’s left. As event-driven architectures become increasingly common, EventBridge Pipes have great efficiency and cost-saving potential.
IAM NotAction
I thought this was a misprint until I checked the docs! Where Action matches the action(s) that will be allowed or denied, NotAction matches everything except the specified list of actions.
So, where this policy allows the deletion of any S3 bucket in an account:
Amazon S3 Access Points simplify data access for any AWS service or customer application that stores data in S3. With S3 Access Points, customers can create unique access control policies for each access point to easily control access to shared datasets.
Customers with shared datasets including data lakes, media archives, and user-generated content can easily scale access for hundreds of applications by creating individualized access points with names and permissions customized for each application.
S3 Access Points look like they can take lots of pain out of bucket policies and IAM config. This would be a big help with sharing datasets, controlling object access and setting environment variables.
Summary
In this post, I examine my attitudes toward certification and how I use my certifications after earning them.
Certifications aren’t for everyone, and that’s fine. As regards my attitudes toward certification, they’re great at improving my confidence, expanding my horizons and making me a better, more complete engineer.
AWS have a range of skill builders, workshops and whitepapers to help people on their certification journey. Check them out! If this post has been useful, the button below has links for contact, socials, projects and sessions:
Towards the end of last year, I used YearCompass for the first time because I wanted to commit to some 2023 goals. YearCompass is a proven and long-lived framework with over 18k Facebook Likes and availability in 52 languages, so it made sense to try it out.
It went very well! So much so that I have used YearCompass again to choose my 2024 professional goals. The first half of this post covers 2023; the second half 2024.
YearCompass is a free booklet that helps you reflect on the year and plan the next one. With a set of carefully selected questions and exercises, YearCompass helps you uncover your own patterns and design the ideal year for yourself.
YearCompass.com
YearCompass started as a reflection tool for a small group of friends and was made publicly available in 2012. It is available as an A4 and A5 PDF, with options to fill out the booklet both digitally and by hand. YearCompass is currently available in 52 languages.
YearCompass positions itself as an alternative to New Year’s Resolutions. Each PDF has two sections. The first half examines the previous year and the second half considers the next one.
Each section consists of a series of prompts and questions. These guide the user through the reflection process and help them identify their priorities and plan for the future.
Some of the questions are:
What are you most proud of?
Who are the three people who influenced you the most?
What does the year ahead of you look like?
While prompts include:
List your three biggest challenges from last year.
This year, I will be bravest when…
I want to achieve these three things the most.
There are no hard and fast rules for completing YearCompass. The book suggests a break between sections, although some prefer to do the whole thing in one sitting. Personally, I don’t complete every section as by a certain point I have what I need.
This year, I had my 2022 and 2023 YearCompass PDFs open side by side. It made sense for 2022’s compass to inform 2023’s, and it gave me an idea of which goal-setting approaches worked best.
2023 Retrospective
In this section, I look back at my 2023 goals and see how things went with them.
Confidence Building & Anxiety Management
This goal was focused on self-belief. I wanted to bolster my confidence and improve my technical skillset.
2022 saw my first tech conference at AWS Summit London. While London is an intense experience for a socially anxious shark, it successfully expanded my comfort zone by putting me around unfamiliar faces with similar interests.
2023’s summit was easier on the senses, and I had chats with suppliers and AWS Solution Architects about topics including data lineage, lakehousing and event orchestration.
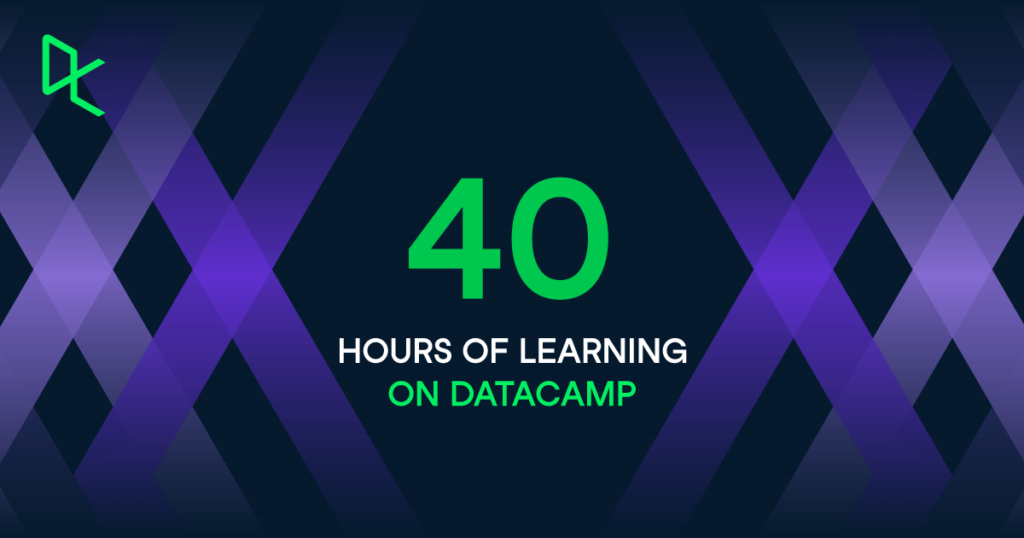
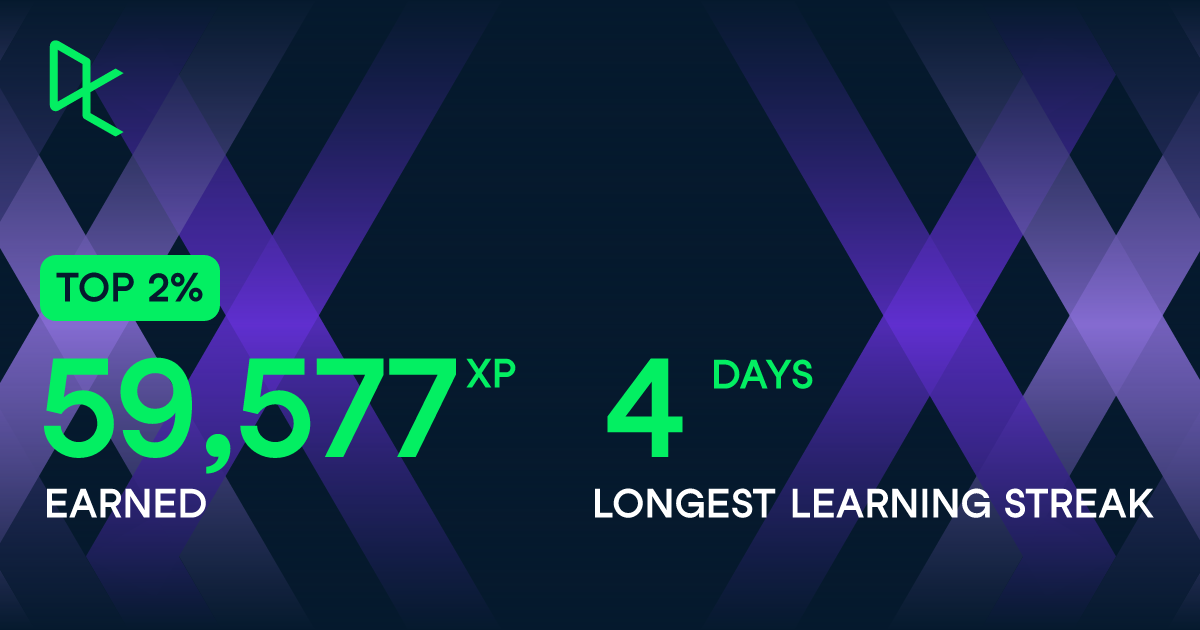
Helpfully, DataCamp has a new My Year In Data feature that summarises the 17 courses I completed this year:
Finally, I also recertified my AWS SysOps Administrator certification in October using the now-traditional duo of Stephane Maarek and Tutorials Dojo. This certification validates my experience in deploying, managing, and operating workloads on AWS and puts me in a good position for my 2024 goals.
Collaborating & Communicating
This goal was focused on finding my voice and improving my work quality. I wanted to strengthen my contributions and increase my value.
A big part of this was making sure that I understood the languages and terms being used around me. My ultimate aim was to use and apply these terms correctly and appropriately. 2023 was the year I became familiar with data and programming terms including:
Finally, I also made it to my first User Group meeting! While I only made it to one event this year, I overcame a lot of personal anxiety there and look forward to exploring my local user groups more in 2024.
Knowledge Sharing & Presenting
This goal was focused on creating value. I wanted to improve my presentation skills, and find real-world applications for the knowledge gained from my posts and certifications.
Upon viewing the event’s Call For Speakers, I saw a great chance to work on this goal. I’d already started writing a VSCode Data Wrangler post at the time (which ultimately became the New Stars Of Data Retrospective post) and quickly realised the post would lend itself very well to the requested abstract.
When creating the session, the combination of a sport I enjoy, data and code I’m familiar with and an impressive VSCode extension resulted in a smooth journey from storyboarding to delivery. The session was a pleasure to create and deliver, and was exactly the presenting introduction I was after!
I also wrote a blog series while creating the session, both as something to look back on and to potentially help future speakers.
2024 Goals
In this section, I use YearCompass to decide on my 2024 professional goals. For each goal, I’ll write a user story and then explain my reasoning.
Build Technology Projects
As a cloud enthusiast, I want to complete valuable project builds so that I can develop and validate my knowledge and skills, and have subject matter for future session abstracts.
It’s fair to say that 2023 has been a year of learning, with sources including:
All of which have given me ideas for things I can build! Some completely new things. Some things that have been gaining steam for a while. Other things that recent innovations have put within reach.
My first YearCompass 2024 goal is to start building them! As well as testing my skills and validating my knowledge, some of these projects would probably lend themselves to a session abstract or two!
Additionally, I’m considering studying towards an AWS Professional certification in 2025. So if I decide to go ahead with that, building a bunch of stuff would be well worth the effort and investment!
Finally, although I’ve gotten better at finishing projects since starting amazonwebshark there’s always room for improvement. This No Boilerplate video about The Cult Of Done Manifesto really resonated with me upon first watch, and I’ll be benchmarking my 2024 projects against it.
Build My Personal Brand
As an IT professional I want to build my personal brand so that I improve my soft skills and define my public image.
Continuing the build theme, my second YearCompass 2024 goal is focused on my soft skills and visibility.
I’ve spoken about confidence and anxiety previously. I will always be working on this, but it isn’t something I want to hide behind. As my contributions to this site and the wider community grow, I need to consider how those contributions influence the projected image of my personality, skills, experience, and behaviour.
Furthermore, in an age where AI tools and models are getting increasingly adept at a range of tasks, practising and demonstrating my soft skills is perhaps more important than ever. As technology becomes increasingly democratised, it is no longer enough to focus on technical skills alone.
I’ve already begun to establish my personal brand via amazonwebshark and social media. With my 2024 goals likely to put me in front of more fresh faces for the first time, now is definitely the time to make my personal brand a primary focus.
Build A Second Brain
Asjust a normal manI want to build a second brain so that I can organise my resources and work more efficiently.
For my final YearCompass 2024 goal, I want to take steps to solve a long-standing problem.
I have lots of stuff. Books, files, hyperlinks, videos…STUFF. Useful stuff, but unorganised and unstructured stuff. I also have lots of ideas. Ideas for efficiency and growth. Ideas for reliability and resilience. And I have various ways of capturing these ideas depending on where I happen to be. Even my car has a notepad.
Finally, and perhaps most importantly, I have several partially-enacted systems for handling all of this. Some systems turned out to be unfit for purpose. Some were overwhelmed, while others became unwieldy.
Recently, I’ve made efforts to organise and define everything. I’m already finding success with this, and with the recent discovery of the Second Brain and CODE methodologies I now have a framework to utilise. A well-built second brain will help organise my backlog, assist my day-to-day and support my future goals.
Summary
In this post, I used the free YearCompass booklet to reflect on 2023 and to plan some professional goals for 2024.
Having finished this post, I’m happy with my 2024 goals and am looking forward to seeing where the year takes me! I’ll post updates here and via my social, project and session links, which are available via the button below:
With New Stars Of Data 6 now in the history books, I wanted to write a final retrospective post for my series. Firstly, I’ll examine both the Sale Sizzler data and VS Code Data Wrangler as a companion post for the session. Then I’ll sum up how the final week of preparation went and draw the series to a close.
This section of my New Stars Of Data retrospective explains what the Sale Sizzlers are and examines the data generated by a typical event.
Sale Sizzler Events
The Sale Sizzlers are a 5k road race series organised by my running club – Sale Harriers Manchester. Every Summer, four events take place at Wythenshawe Park in two-week intervals. The course is regarded as one of the fastest in North West England and attracts a wide range of participants from first-time racers to former Olympians.
They began in the same year as the 2002 Commonwealth Games (also held in Manchester). Since then, thousands of runners have participated in the name of enjoyment, charity and personal bests.
Sale Sizzler Data
Sale Sizzler administration has changed over the years in response to both popularity and technology. Initially, everything was paper-based from entries to results. Then, as the Internet became more established, some processes moved online.
It offers features for quickly identifying and fixing errors, inconsistencies, and missing data. Data profiling, quality checks and formatting operations are also available.
Data Wrangler uses a no-code interface, and generates Python code behind the scenes using the pandas and regex open-source libraries. Transformations can be exported as Jupyter Notebooks, Python scripts and CSVs.
Data Wrangler Documentation
The Data Wrangler GitHub repo has excellent documentation. I’m not going to reproduce it here, because:
The repo deserves the traffic.
Data Wrangler is constantly being updated so the instructions can easily change.
The Readme is very well written and needs no improvement.
I will, however, highlight the following key areas:
Finally, the Changelog shows Data Wrangler’s version history.
The rest of this section examines the Data Wrangler operations I used in my demo.
Missing Value Operations
The first two operations in my demo removed the dataset’s 1123 missing values by:
Dropping missing Position values
Filling missing Club values
Most of the missing values belonged to runners who either didn’t start the race or didn’t finish it. These people had no finish time, which is a vital metric in my session and necessitated their removal from the dataset.
Removing these runners left 45 missing values in the Club column. These were runners unaffiliated to a running club. The fix this time was to replace empty values with Unaffiliated, leaving no missing values at all.
The Data Wrangler GUI uses Git-like representation for the Fill Missing Values operation, where the red column is before the change and green is after:
Wrangler generated this Python code to update the Club column:
# Replace missing values with "Unaffiliated" in column: 'Club'
df = df.fillna({'Club': "Unaffiliated"})
Column Creation Operations
Next, I wanted to create some columns using the New Column By Example operation. Firstly, Data Wrangler requests target columns and a creation pattern. Microsoft Flash Fill then automatically creates a column when a pattern is detected from the columns chosen.
I created two new columns by:
Combining First Name and Last Name to make Full Name.
Combining Gender and Category to make Gender Category.
Both these columns simplify reporting. The Full Name column is easier to read than the separate First and Last Name columns, and brings the Nifty data in line with other data producers like Run Britain. Additionally, using the Full Name column in Power BI tables takes less space than using both of its parent columns.
Having a Gender Category column is not only for quality of life, but also for clarity. Most of the Category values like U20 and V50 don’t reveal the runner’s gender. Conversely, Gender Category values like Female U20 and Male V50 are obvious, unambiguous and better than Category values alone.
This GIF from the demo shows how the Gender Category column is created:
During this, Data Wrangler generated this Python code:
# Derive column 'Gender Category' from columns: 'Gender', 'Category'
# Transform based on the following examples:
#    Category    Gender    Output
# 1: "Under 20"  "Male" => "Male Under 20"
df.insert(12, "Gender Category", df["Gender"] + " " + df["Category"])
This works, but produces a slight issue with the Senior Female and Senior Male values. In the case of Senior Male, Flash Fill outputs the new value of Male Senior Male (20-39).
This is correct, but the Male duplication is undesirable. This is resolved by identifying an instance of this value and removing the second Male string:
This updates the Python code to:
# Derive column 'Gender Category' from columns: 'Gender', 'Category'
# Transform based on the following examples:
#    Category               Gender    Output
# 1: "Under 20"             "Male" => "Male Under 20"
# 2: "Senior Male (20-39)"  "Male" => "Male Senior (20-39)"
df.insert(12, "Gender Category", df.apply(lambda row : row["Gender"] + " " + row["Category"].split(" ")[0] + row["Category"][row["Category"].rfind(" "):], axis=1))
And the replacement values for both genders become Female Senior (20-34) and Male Senior (20-39).
Bespoke Operations
Finally, I wanted to demonstrate how to use bespoke Python code within Data Wrangler. My first operation was to add a column identifying the event:
df['Event'] = 'Sale Sizzler 1'
This creates an Event column containing Sale Sizzler 1 in each row.
My second was a little more involved. The Sale Sizzler finish times are represented as HH:MM:SS. Power BI can show these values as strings but can’t use them for calculations. A better option was to transform them to total seconds, because as integers they are far more versatile.
This transformation can be done in DAX, but every dataset refresh would recalculate the values. This is unnecessarily computationally expensive. As the finish times will never change, it makes sense to apply Roche’s Maxim of Data Transformation and transform them upstream of Power BI using Data Wrangler.
This avoids Power BI having to do unnecessary repeat work, and indeed removes the need for Power BI to calculate the values at all! This also allows both the data model and the visuals using the transformed data to load faster.
Here is my custom Python code:
df['Chip Time Seconds'] = df['Chip time'].apply(lambda x: int(x.split(':')[0])*3600+ int(x.split(':')[1])*60 +int(x.split(':')[2]))
This uses the split method and a lambda function to apply the following steps to each Chip Time value to calculate an equivalent Chip Time Seconds value:
Hours to seconds: capture the first number and multiply it by 3600.
Minutes to seconds: capture the second number and multiply it by 60.
Seconds: capture the third number.
Add all values together
So with the example of a Chip Time value of 00:15:11:
00 * 3600 = 0 seconds
15 * 60 = 900 seconds
11 seconds
0 + 900 + 11 = 911 Chip Time Seconds
These integers can then be used to calculate averages, high performers and key influencers. The full demo is in the session recording that is included further down this post.
Session
This section of my New Stars Of Data retrospective is about my final preparations and the day itself.
Final Week
Before my final meeting with Olivier, he asked me to think about my plans both for the week of the event and the day itself. This was surprisingly hard! I’d spent so much time on the build-up that I hadn’t even considered this.
The final meetup was divided into taking stock of the journey to get to event week, and some final discussion over event expectations and etiquette. New Stars Of Data uses Microsoft Teams for delivery, which I have lots of experience with through work. Olivier made sure I knew when to turn up and what to do.
Following some thought and input from Olivier, I did my final rehearsals at the start of the week and did a final run-through on Wednesday. After that, I took Olivier’s advice and gave myself time to mentally prepare for the big day.
The Big Day!
I spent Friday morning doing house and garden jobs. Basically staying as far away from the laptop as possible to keep my anxiety low. At noon I sprung into action, setting up my streaming devices, checking my demos worked and confirming I could access the Teams channel. Then I walked Wolfie to tire him out before my session. It turned out that Wolfie had other ideas!
New Stars Of Data has fifteen-minute windows between sessions for speaker transitions, and during this I chatted with the moderators who helped me stay calm. Wolfie stayed quiet during the whole time, then started barking two minutes in. Thankfully, I’d practised handling distractions!
The session felt like it flew by, and the demos went mostly as planned. One of the New Column By Example transformations in the Data Wrangler demo didn’t work as expected, erroring instead of giving the desired values.
This had happened during rehearsals, so I was prepared for the possibility of it failing again. To this end, I pre-recorded a successful transformation and stored the Python code generated by the operation. I wasn’t able to show the recording due to time constraints, but used the Python code to show what the expected output should have been.
Well, I had always planned to take my foot off the gas a little after completing New Stars Of Data to appreciate the experience (and write this retrospective!). I’ve been working on it since June, and I wanted to have some time for consideration and reflection.
With respect to Racing Towards Insights, I have a couple of optimisations I’m considering. These include using a virtual machine for the Power BI demos to take the pressure off my laptop, examining options for a thirty-minute version of the session for other events and looking at applications for the Python code export function.
I’m also keen to find out how to avoid the New Column By Example error I experienced. To this end, I’ve raised an issue on the Data Wrangler GitHub repo and will see if I can narrow down the problem.
Additionally, I’ve had several positive conversations with people about submitting sessions for local user groups and community events, and have several ideas for blog topics and personal projects that could lend themselves to session abstracts. With the knowledge gained from Olivier’s mentorship, I can now start to think about what these abstracts might look like.
Summary
In this post, I wrote a retrospective review of my New Stars Of Data 6 session and overall experience. In closing, I’d like to thank the following community members for being part of my New Stars Of Data journey:
Olivier Van Steenlandt for his knowledge, guidance and experience. And for putting up with me for four months.