I’m a speaker now! In this post, I write a retrospective review of my New Stars Of Data 6 session and overall experience.
Table of Contents
Introduction
In July, I shared the news that I was speaking at the October 2023 New Stars Of Data event:

In August and October, I wrote about my preparations and experiences leading up to the event. Since then, the big day has come and gone!
With New Stars Of Data 6 now in the history books, I wanted to write a final retrospective post for my series. Firstly, I’ll examine both the Sale Sizzler data and VS Code Data Wrangler as a companion post for the session. Then I’ll sum up how the final week of preparation went and draw the series to a close.
Separately, my mentor Olivier Van Steenlandt has written about his mentoring experience on his blog. Give it a read!
Sale Sizzlers
This section of my New Stars Of Data retrospective explains what the Sale Sizzlers are and examines the data generated by a typical event.
Sale Sizzler Events
The Sale Sizzlers are a 5k road race series organised by my running club – Sale Harriers Manchester. Every Summer, four events take place at Wythenshawe Park in two-week intervals. The course is regarded as one of the fastest in North West England and attracts a wide range of participants from first-time racers to former Olympians.

They began in the same year as the 2002 Commonwealth Games (also held in Manchester). Since then, thousands of runners have participated in the name of enjoyment, charity and personal bests.
Sale Sizzler Data
Sale Sizzler administration has changed over the years in response to both popularity and technology. Initially, everything was paper-based from entries to results. Then, as the Internet became more established, some processes moved online.
Today, everything from runner entry to results distribution can be completely outsourced to third parties. Since 2016, Nifty Entries have handled Sale Sizzlers administration and published the results as CSVs on their platform. Nifty’s Sale Sizzler data privacy policy is available here.
I used the 2023 Sale Sizzler 1’s CSV for my demo. As of 2023, these CSVs contain the following columns:
| Position | INT | Runner’s overall finishing position. |
| Finish Time | TIME | Time from race start to runner crossing finish line. |
| Number | INT | Runner’s race number. |
| First Name | STRING | Runner’s first name |
| Last Name | STRING | Runner’s last name. |
| Chip Time | TIME | Time from runner crossing start line to runner crossing finish line. |
| Club | STRING | Runner’s running club (if applicable) |
| Club Position | INT | Runner’s finishing position relative to their running club. |
| Gender | STRING | Runner’s gender. |
| Gender Position | INT | Runner’s finishing position relative to their gender. |
| Category | STRING | Runner’s age group. |
| Category Position | INT | Runner’s finishing position relative to their age group. |
That’s all the required knowledge for the Sizzlers. Now let’s examine the catalyst for my session – Data Wrangler.
VS Code Data Wrangler
This section of my New Stars Of Data retrospective examines VS Code Data Wrangler’s features and the operations I used in my session demo.
Data Wrangler Features
The Data Wrangler Extension for Visual Studio Code was launched in March 2023. It is designed to help with data preparation, cleaning, and presentation, and has a library of built-in transformations and visualizations.
It offers features for quickly identifying and fixing errors, inconsistencies, and missing data. Data profiling, quality checks and formatting operations are also available.
Data Wrangler uses a no-code interface, and generates Python code behind the scenes using the pandas and regex open-source libraries. Transformations can be exported as Jupyter Notebooks, Python scripts and CSVs.
Data Wrangler Documentation
The Data Wrangler GitHub repo has excellent documentation. I’m not going to reproduce it here, because:
- The repo deserves the traffic.
- Data Wrangler is constantly being updated so the instructions can easily change.
- The Readme is very well written and needs no improvement.
I will, however, highlight the following key areas:
- Setting Up Your Environment profiles Data Wrangler’s dependencies.
- Using Data Wrangler explains Data Wrangler’s interface and components.
- Data Wrangler Operations details the operations that can be performed against datasets.
- Finally, the Changelog shows Data Wrangler’s version history.
The rest of this section examines the Data Wrangler operations I used in my demo.
Missing Value Operations
The first two operations in my demo removed the dataset’s 1123 missing values by:
- Dropping missing Position values
- Filling missing Club values
Most of the missing values belonged to runners who either didn’t start the race or didn’t finish it. These people had no finish time, which is a vital metric in my session and necessitated their removal from the dataset.
Removing these runners left 45 missing values in the Club column. These were runners unaffiliated to a running club. The fix this time was to replace empty values with Unaffiliated, leaving no missing values at all.
The Data Wrangler GUI uses Git-like representation for the Fill Missing Values operation, where the red column is before the change and green is after:

Wrangler generated this Python code to update the Club column:
# Replace missing values with "Unaffiliated" in column: 'Club'
df = df.fillna({'Club': "Unaffiliated"})
Column Creation Operations
Next, I wanted to create some columns using the New Column By Example operation. Firstly, Data Wrangler requests target columns and a creation pattern. Microsoft Flash Fill then automatically creates a column when a pattern is detected from the columns chosen.
I created two new columns by:
- Combining First Name and Last Name to make Full Name.
- Combining Gender and Category to make Gender Category.
Both these columns simplify reporting. The Full Name column is easier to read than the separate First and Last Name columns, and brings the Nifty data in line with other data producers like Run Britain. Additionally, using the Full Name column in Power BI tables takes less space than using both of its parent columns.
Having a Gender Category column is not only for quality of life, but also for clarity. Most of the Category values like U20 and V50 don’t reveal the runner’s gender. Conversely, Gender Category values like Female U20 and Male V50 are obvious, unambiguous and better than Category values alone.
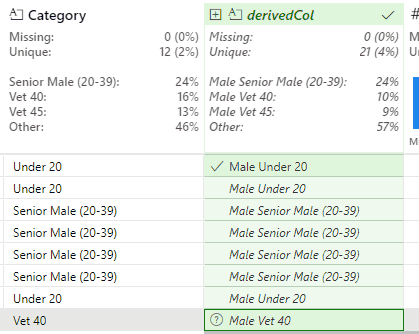
This GIF from the demo shows how the Gender Category column is created:

During this, Data Wrangler generated this Python code:
# Derive column 'Gender Category' from columns: 'Gender', 'Category'
# Transform based on the following examples:
#    Category    Gender    Output
# 1: "Under 20"  "Male" => "Male Under 20"
df.insert(12, "Gender Category", df["Gender"] + " " + df["Category"])
This works, but produces a slight issue with the Senior Female and Senior Male values. In the case of Senior Male, Flash Fill outputs the new value of Male Senior Male (20-39).
This is correct, but the Male duplication is undesirable. This is resolved by identifying an instance of this value and removing the second Male string:
This updates the Python code to:
# Derive column 'Gender Category' from columns: 'Gender', 'Category'
# Transform based on the following examples:
#    Category               Gender    Output
# 1: "Under 20"             "Male" => "Male Under 20"
# 2: "Senior Male (20-39)"  "Male" => "Male Senior (20-39)"
df.insert(12, "Gender Category", df.apply(lambda row : row["Gender"] + " " + row["Category"].split(" ")[0] + row["Category"][row["Category"].rfind(" "):], axis=1))
And the replacement values for both genders become Female Senior (20-34) and Male Senior (20-39).
Bespoke Operations
Finally, I wanted to demonstrate how to use bespoke Python code within Data Wrangler. My first operation was to add a column identifying the event:
df['Event'] = 'Sale Sizzler 1'
This creates an Event column containing Sale Sizzler 1 in each row.
My second was a little more involved. The Sale Sizzler finish times are represented as HH:MM:SS. Power BI can show these values as strings but can’t use them for calculations. A better option was to transform them to total seconds, because as integers they are far more versatile.
This transformation can be done in DAX, but every dataset refresh would recalculate the values. This is unnecessarily computationally expensive. As the finish times will never change, it makes sense to apply Roche’s Maxim of Data Transformation and transform them upstream of Power BI using Data Wrangler.
This avoids Power BI having to do unnecessary repeat work, and indeed removes the need for Power BI to calculate the values at all! This also allows both the data model and the visuals using the transformed data to load faster.
Here is my custom Python code:
df['Chip Time Seconds'] = df['Chip time'].apply(lambda x: int(x.split(':')[0])*3600+ int(x.split(':')[1])*60 +int(x.split(':')[2]))
This uses the split method and a lambda function to apply the following steps to each Chip Time value to calculate an equivalent Chip Time Seconds value:
- Hours to seconds: capture the first number and multiply it by 3600.
- Minutes to seconds: capture the second number and multiply it by 60.
- Seconds: capture the third number.
- Add all values together
So with the example of a Chip Time value of 00:15:11:
- 00 * 3600 = 0 seconds
- 15 * 60 = 900 seconds
- 11 seconds
- 0 + 900 + 11 = 911 Chip Time Seconds
These integers can then be used to calculate averages, high performers and key influencers. The full demo is in the session recording that is included further down this post.
Session
This section of my New Stars Of Data retrospective is about my final preparations and the day itself.
Final Week
Before my final meeting with Olivier, he asked me to think about my plans both for the week of the event and the day itself. This was surprisingly hard! I’d spent so much time on the build-up that I hadn’t even considered this.
The final meetup was divided into taking stock of the journey to get to event week, and some final discussion over event expectations and etiquette. New Stars Of Data uses Microsoft Teams for delivery, which I have lots of experience with through work. Olivier made sure I knew when to turn up and what to do.
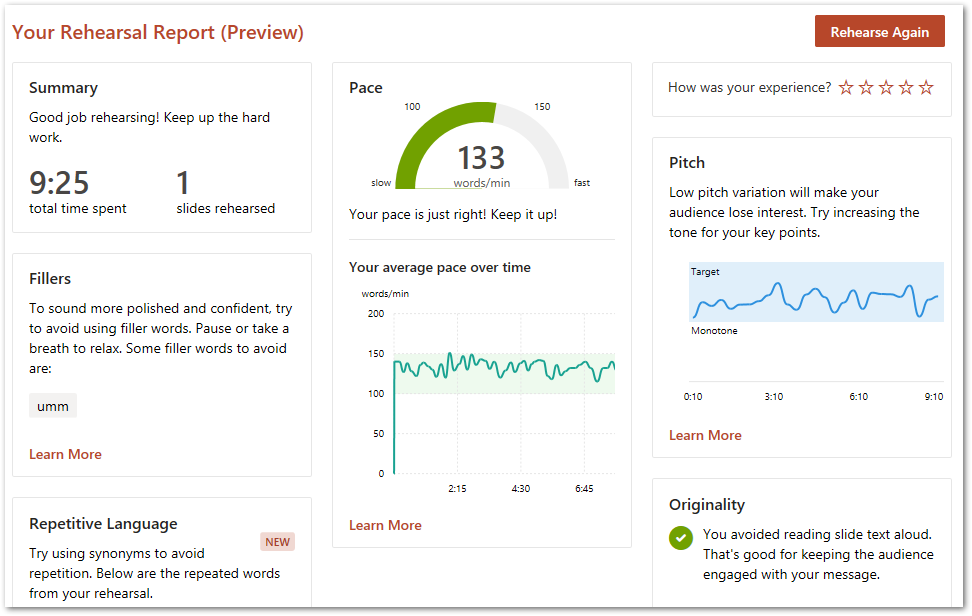
Following some thought and input from Olivier, I did my final rehearsals at the start of the week and did a final run-through on Wednesday. After that, I took Olivier’s advice and gave myself time to mentally prepare for the big day.
The Big Day!
I spent Friday morning doing house and garden jobs. Basically staying as far away from the laptop as possible to keep my anxiety low. At noon I sprung into action, setting up my streaming devices, checking my demos worked and confirming I could access the Teams channel. Then I walked Wolfie to tire him out before my session. It turned out that Wolfie had other ideas!
New Stars Of Data has fifteen-minute windows between sessions for speaker transitions, and during this I chatted with the moderators who helped me stay calm. Wolfie stayed quiet during the whole time, then started barking two minutes in. Thankfully, I’d practised handling distractions!
The session felt like it flew by, and the demos went mostly as planned. One of the New Column By Example transformations in the Data Wrangler demo didn’t work as expected, erroring instead of giving the desired values.
This had happened during rehearsals, so I was prepared for the possibility of it failing again. To this end, I pre-recorded a successful transformation and stored the Python code generated by the operation. I wasn’t able to show the recording due to time constraints, but used the Python code to show what the expected output should have been.
My session was recorded and is on the DataGrillen YouTube channel:
I uploaded my session files to my Community-Sessions GitHub repo. If that naming schema sounds ambitious, well…
Future Plans
So, having presented my first session, what next?
Well, I had always planned to take my foot off the gas a little after completing New Stars Of Data to appreciate the experience (and write this retrospective!). I’ve been working on it since June, and I wanted to have some time for consideration and reflection.
With respect to Racing Towards Insights, I have a couple of optimisations I’m considering. These include using a virtual machine for the Power BI demos to take the pressure off my laptop, examining options for a thirty-minute version of the session for other events and looking at applications for the Python code export function.
I’m also keen to find out how to avoid the New Column By Example error I experienced. To this end, I’ve raised an issue on the Data Wrangler GitHub repo and will see if I can narrow down the problem.
Additionally, I’ve had several positive conversations with people about submitting sessions for local user groups and community events, and have several ideas for blog topics and personal projects that could lend themselves to session abstracts. With the knowledge gained from Olivier’s mentorship, I can now start to think about what these abstracts might look like.
Summary
In this post, I wrote a retrospective review of my New Stars Of Data 6 session and overall experience. In closing, I’d like to thank the following community members for being part of my New Stars Of Data journey:
- Olivier Van Steenlandt for his knowledge, guidance and experience. And for putting up with me for four months.
- Ben Weissman & William Durkin for the New Stars Of Data concept and platform.
- Steve Jones, Rob Sewell, and Johan Ludvig Brattås for their contributions to the New Stars Of Data Speaker Improvement Library and subsequent encouragement.
- Grant Fritchey for his advice and support.
- Barney Lawrence for introducing me to Roche’s Maxim of Data Transformation with the most perfect timing.
- Brent Ozar for his various speaking-centric posts and for introducing me to the catalyst for applying to New Stars Of Data: Year Compass
- Paul Randal for helping me to crystalise my 2023 aims and consider tracking and accountability.
- Bob Gregory for lighting my ‘Have a go’ spark with his AWS Comsum 2022 session.
If this post has been useful, the button below has links for contact, socials, projects and sessions:

Thanks for reading ~~^~~