In this post, I talk about my final preparations for the upcoming New Stars Of Data 6 event in October 2023.
Table of Contents
Introduction
In July, I shared the news that I’m speaking at the next New Stars Of Data event in October:

Last month I talked about how the slides were coming along, and about getting my presentation setup ready. So what have I been up to since?
Presentation Slides
In this section, I talk about the presentation slides for my session.
Content
The presentation has been mostly finished since the start of October. My mentor Olivier Van Steenlandt suggested that I commit to this deadline early in the process, and now I see why – it makes practising far easier! I’m still making minor tweaks based on delivery observations and feedback, but the slides now have the required content in the desired order.
I’ve also included some Unsplash images and personal photos in the deck. These images simplify and enhance the message of the slides they’re on, and inject some variety into the session.
Style
After some thought, I decided to add a slide theme to the deck. It was fine without one, but I felt the right theme would add some extra polish. So I duplicated the presentation and experimented with PowerPoint’s default themes.
I eventually decided on the Facet theme with the Office colour palette. It was easily the best fit of the default themes, with good colour and white space balance. I could have reviewed others online or made my own, but as the theme is basically an optional extra I didn’t want to put more time into the decision than was necessary.
So my presentation has gone from this:
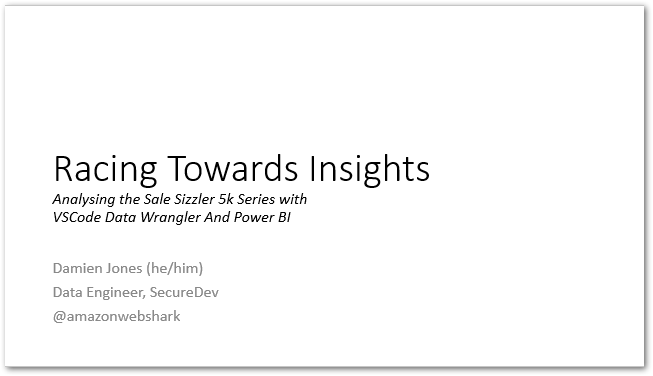
To this:
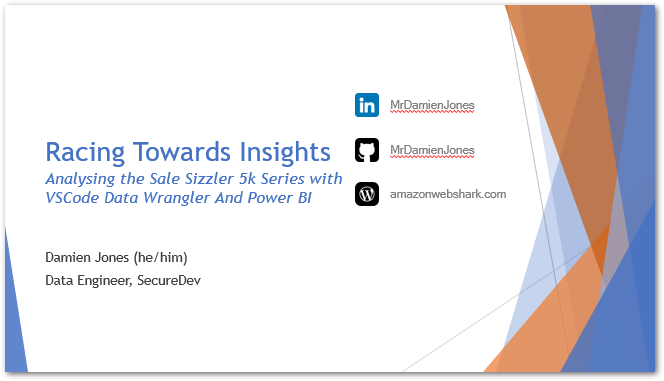
I’m really happy with how it turned out!
Demo Material
In this section, I’ll talk about my session’s demos.
Demos form a big part of my session. I have two: a Data Wrangler demo showing several data transformations, and a Power BI demo showing visuals and insights generated from the wrangled data.
Data Wrangler Demo
The Data Wrangler is a great tool, and I want my demo to show it both in the best possible light, and in the context of an actual use case. So I spent time with the wrangler’s documentation and sample content to find the best transformations for my session.
Next, I considered how I’d transform the data in my day job and what I wanted to report against in Power BI. This quickly established an order of operations, governed by complexity (some transformations are simpler than others) and dependence (some transformations rely on others).
Finally, I drew up a rough end-to-end process and began to practise. The limited selection of transformations keeps the demo focused and streamlined, and knowing the order of operations helps my fluency and delivery.
Power BI Demo
For the Power BI demo, I considered what insights a race director would be most interested in that they couldn’t get from the CSV data alone. This led me towards visuals that would analyse the entire Sizzler series, like the Key Influencers and Distribution Tree visuals.
Next, I built some visuals and reviewed them in terms of how helpful they were, and how complex they were to explain. Complex visuals run the risk of alienating some viewers, which I would prefer to avoid!
Having selected my visuals, I tuned their filters and data fields to add value. For example, knowing that a 70-year-old male is faster than an under-18-year-old male isn’t valuable, but comparing the fastest speeds of all 70-year-old males across the series is!
Finally, I looked for links between the visuals and wrote practise notes based on them. For example, discussing the fastest times for each race leads into the key influencers for decreased chip times. In practice, this helps me tell a story with the data and provides a clear narrative for the demo.
Demo Resilience
There are always risks with live demos. Maybe an update will change the way a process runs. Perhaps a breaking change will stop a feature from working entirely. The program might not even load at all! So what’s the best way of managing those risks when presenting to a live audience?
I have a few aces up my sleeve just in case. Some suggested by Olivier; others off my own back:
- Each Sizzler event has a pre-wrangled CSV. This protects against wrangler bugs and avoids repetition in the session.
- I recorded a silent demo of the wrangler in case the entire extension won’t load.
- All related files are stored on OneDrive in case my laptop dies.
- A laptop change freeze will be applied on the week of the event. Updates for Windows, Ubuntu, VS Code and Power BI will not be applied.
Session Practise
In this section, I talk about perhaps the most important part of my final preparations for New Stars Of Data – practising my session!
Pre Flight
To get my brain used to the tension of waiting for 15:45 on October 27, I use my phone’s timer to count me into a rehearsal. Olivier made a point of practising this with me, and it definitely helps to create the environment I’ll be in on the day!
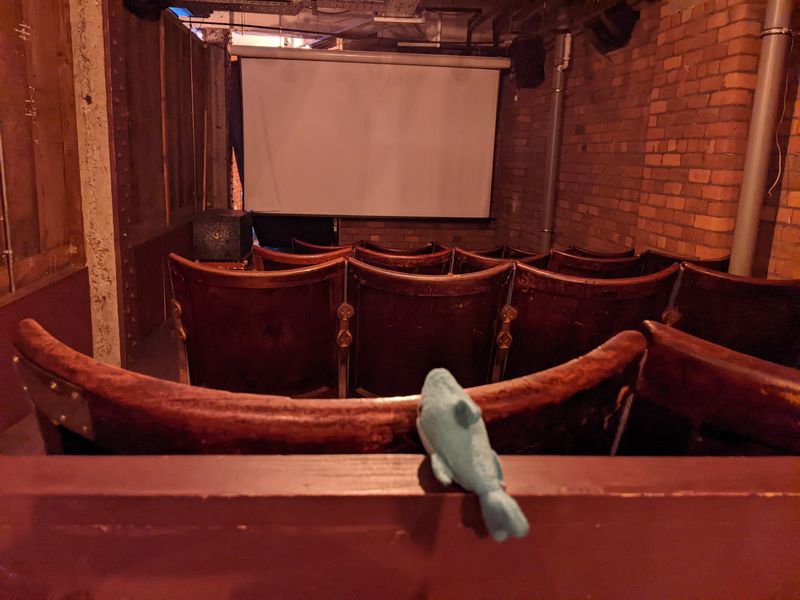
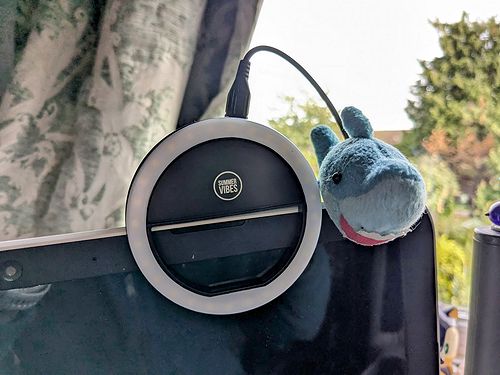
I’m also the proud owner of a cheap ring light, which has indirectly become my clapperboard. When my face is lit, the camera is rolling! While my Logitech Streamcam has a live light, it’s a bit tiny and it can’t compete with my Hollywood lights and director:
Rehearsal
I’m using PowerPoint’s Speaker Coach. It monitors aspects like filler words and slide repetition, and measures pacing and cadence. Speaker Coach offers feedback both during and after a practice session, generating a report with insights and recommendations:
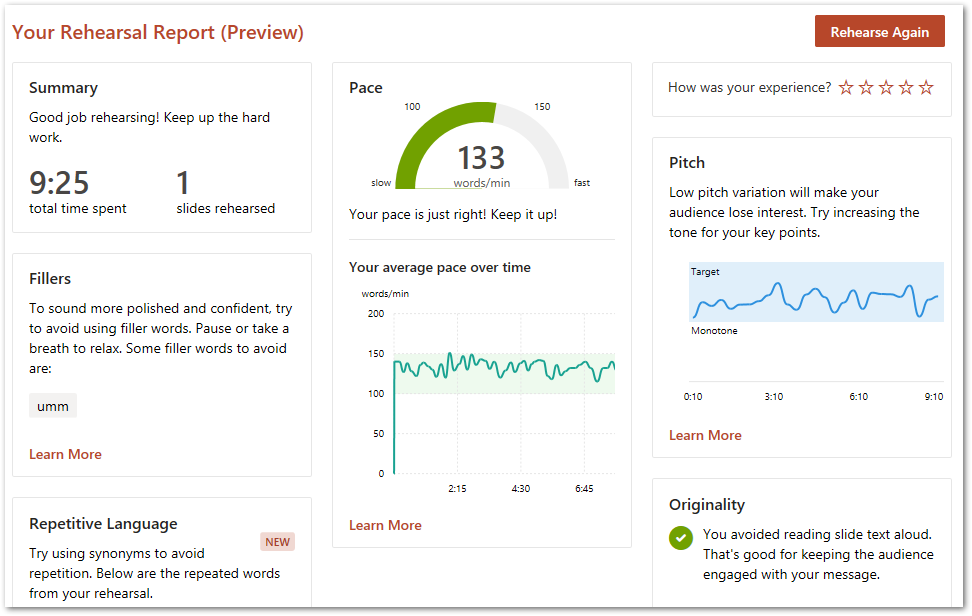
Microsoft has documented Speaker Coach’s suggestions and the research used to determine them, such as:
Based on field study and past academic research, Speaker Coach recommends that presenters speak at a rate of 100 to 165 words per minute; this is the rate at which most audiences we’ve tested find it easiest to process the information they hear.
I’ve also had regular meetings with Olivier to run through the presentation in person. Not all of these went well! But this was the idea. Make mistakes. Loads of mistakes! Because then there’s less chance of them happening on the day!
I was also fortunate enough to get some advice from Redgate Product Advocate Grant Fritchey at October’s Data Relay event. The changes I’ve made to my notes based on his suggestions have been very helpful. Thanks, Grant!
Summary
In this post, I talked about my final preparations for the upcoming New Stars Of Data 6 event in October 2023.
This will be my final post before the event! I’m presenting my Racing Towards Insights session online on October 27 at 15:45. The track links are currently on the New Stars Of Data schedule!
If this post has been useful, please feel free to follow me on the following platforms for future updates:
Thanks for reading ~~^~~