Categories
AI & Machine Learning

DBeaver OpenAI ChatGPT Integration

In this post, I install the new DBeaver OpenAI ChatGPT integration, try it out with some prompts and examine my OpenAI usage costs.

Table of Contents

Introduction

DBeaver is a free database tool and SQL client. It is multi-platform, open-source and supports a variety of databases including Microsoft SQL ServerAmazon Athena and MySQL.

In February 2023, the latest version of DBeaver’s Community Edition was released. Version 22.3.4’s release notes start with:

ChatGPT integration for smart completion and code generation (as optional extension).

ChatGPT has been in the news a lot since its launch in November 2022. It has earned widespread praise and scorn, has been embraced in some places and banned in others and has attracted billions of dollars of investment.

So how does ChatGPT fare in this setting? Let’s find out!

Preparation

In this section, I install and configure DBeaver’s OpenAI ChatGPT integration.

DBeaver’s OpenAI ChatGPT integration is not automatically installed with Version 22.3.4. This makes sense – it’s currently quite new and many users and organisations may not want to install it (for reasons I’ll go into later). This approach keeps DBeaver’s footprint as small as possible and lets people make up their own minds.

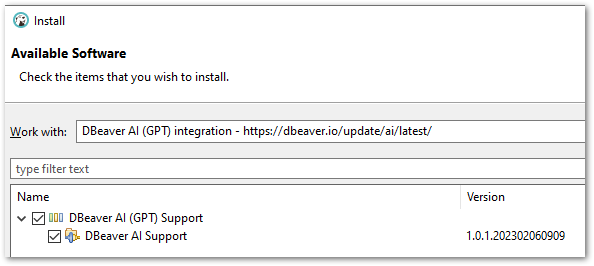
DBeaver’s GitHub wiki covers the installation process, which amounts to:

  • Open DBeaver’s integration installer.
  • Select the DBeaver AI (GPT) integration library.
  • Select and install DBeaver AI (GPT) Support.
2023 02 15 DBeaverPlugins

Following this, the DBeaver OpenAI ChatGPT integration must be configured. This process needs an active API token from the OpenAI platform.

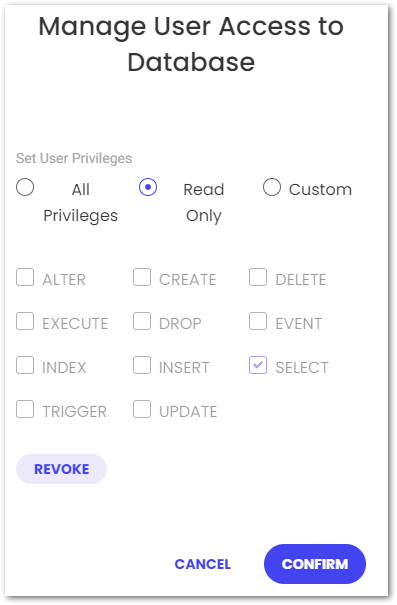
OpenAPI account holders can generate tokens in the API Keys section of their profile. Afterwards, this token must be pasted into the API Token field in DBeaver’s preferences:

2023 02 15 DBeaverGPTPrefs

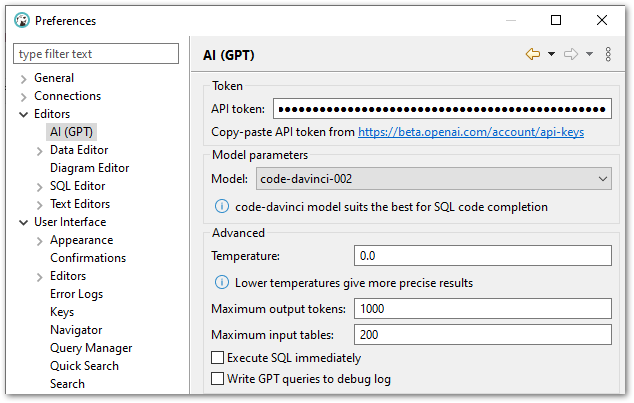
The DBeaver OpenAI ChatGPT integration will now work. The other settings are out of scope for this post and are covered in DBeaver’s wiki.

Separately, I found I was getting SQL 08S01 timeout errors during my first attempts to send ChatGPT prompts. I ended up increasing my database connection’s connectionTimeout value to resolve this.

ChatGPT Data Sharing

There is an important fact to consider when using DBeaver’s OpenAI ChatGPT integration:

DBeaver needs to send database metadata to the OpenAI platform. 

To clarify, this means that DBeaver sends a list of the selected database’s table names and column names to OpenAI.

DBeaver doesn’t hide this fact away. Their wiki is very explicit, and the DBeaver OpenAI ChatGPT integration states this when used for the first time.

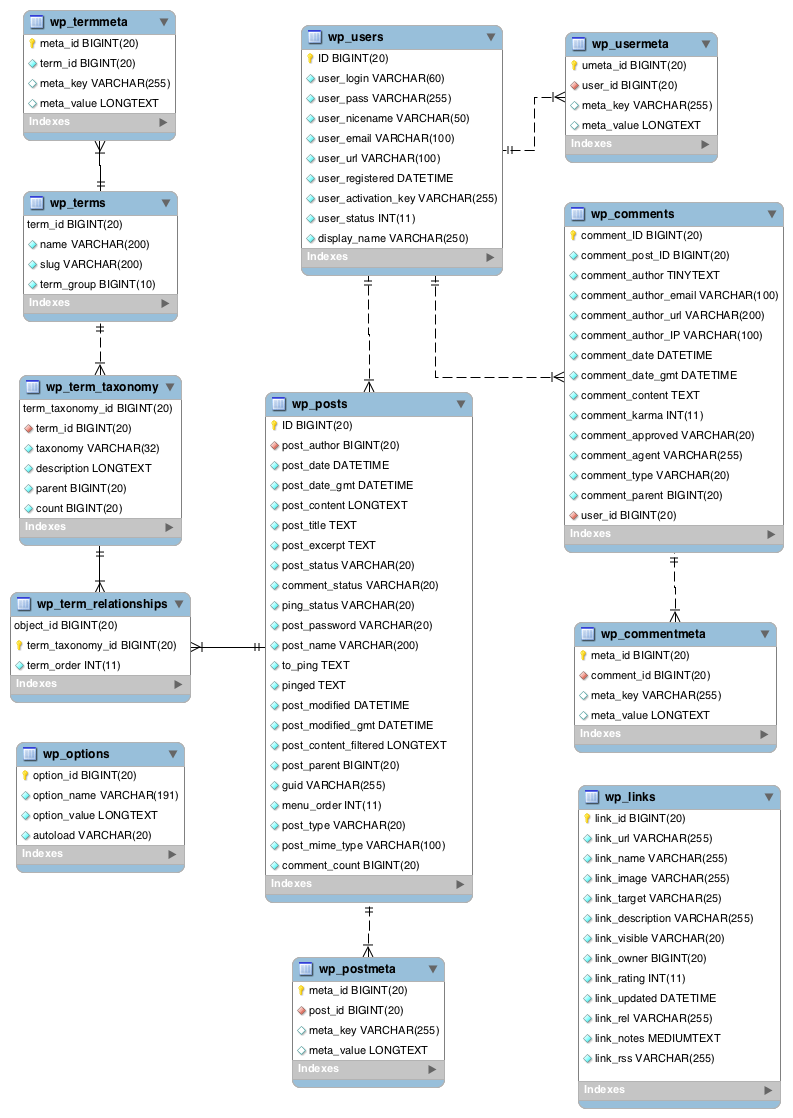
For my purposes, this isn’t a problem. My amazonwebshark MySQL database contains nothing confidential or sensitive, and the tables and columns of a standard WordPress database are well documented.

But I wouldn’t currently use this with databases I don’t own. Although the shared metadata is limited to table names and column names, these can still be sensitive and potentially misused. I’m sure OpenAI have data security measures in place, but as this technology is still quite new I currently prefer to be cautious.

Tests

In this section, I test the DBeaver OpenAI ChatGPT integration with prompts referring to my amazonwebshark MySQL database. Before starting, I should define the concepts of prompts and completions:

  • Prompts are the instructions given to ChatGPT.
  • Completions are ChatGPT’s response to prompts.

Test 1: Category Usage

For my first test, I wanted to answer a question similar to one from my last post:

How many amazonwebshark blog categories have been used more than twice?

I answered the question with this SQL query:

SELECT t.name, tt.count
FROM term_taxonomy AS tt
INNER JOIN terms AS t 
	ON tt.term_id = t.term_id
WHERE tt.taxonomy = 'category'
	AND tt.count > 2

Which returned these results:

namecount
Data & Analytics 6
Me4
Developing & Application Integration8
Security & Monitoring3

Now it’s ChatGPT’s turn! My first prompt for ChatGPT was:

Find all categories used more than 2 times.

GPT’s completion was:

SELECT COUNT(*) AS count, category
FROM statistics_historical
GROUP BY category
HAVING count > 2;

Although this query looks fine, it doesn’t return any results! In fact the whole table has nothing in it:

SELECT COUNT(*) FROM statistics_historical
NameValue
COUNT(*)0

ChatGPT interpreted my prompt literally and searched my database metadata for tables with a category column. This search only returned one table, which is used for archiving purged report data: statistics_historical.

ChatGPT didn’t know that the table was empty, and so had no way to know its query wasn’t appropriate. This was my fault – my prompt needed more work.

Test 2: Category Usage Take 2

For my second test, I tried to re-engineer my prompt to give ChatGPT more insight into my data. My question remained:

“How many amazonwebshark blog categories have been used more than twice?”

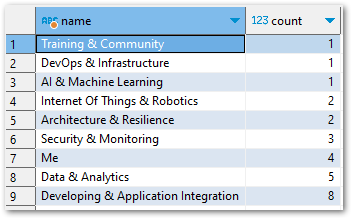
My second prompt was phrased to give ChatGPT some guidance on what to look for:

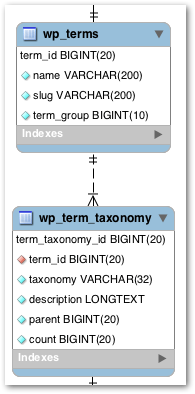
Get all names of terms with taxonomy of category and count greater than 2

This time, GPT’s completion was:

SELECT name, count 
FROM terms 
INNER JOIN term_taxonomy 
	ON terms.term_id = term_taxonomy.term_id 
WHERE term_taxonomy.taxonomy = 'category' 
	AND term_taxonomy.count > 2

This was almost identical to my own SQL query:

SELECT t.name, tt.count
FROM term_taxonomy AS tt
INNER JOIN terms AS t 
	ON tt.term_id = t.term_id
WHERE tt.taxonomy = 'category'
	AND tt.count > 2

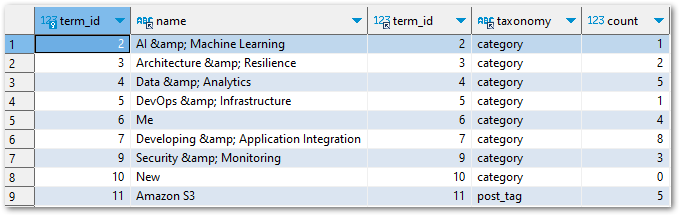
And the results were the same in both cases:

namecount
Data & Analytics 6
Me4
Developing & Application Integration8
Security & Monitoring3

Test 3: Page Views

For my final test I tried a different approach. Instead of writing a SQL query myself, I gave ChatGPT a prompt and then used a WPStatistics report to compare results.

My question is now:

Which amazonwebshark posts have had the highest views in the past week?

I know which table has the data needed for this, so I included it along with some vital columns in my ChatGPT prompt:

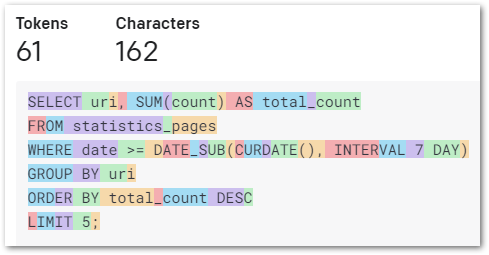
Get the uris for the past week from statistics_pages. Sum all the counts. Show the top 5 in descending order.

GPT’s completion was:

SELECT uri, SUM(count) AS total_count
FROM statistics_pages
WHERE date >= DATE_SUB(CURDATE(), INTERVAL 7 DAY)
GROUP BY uri
ORDER BY total_count DESC
LIMIT 5;

This was impressive! ChatGPT used the table and columns I specified, filtered the dates correctly and limited the results as instructed.

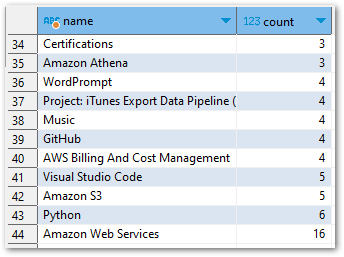
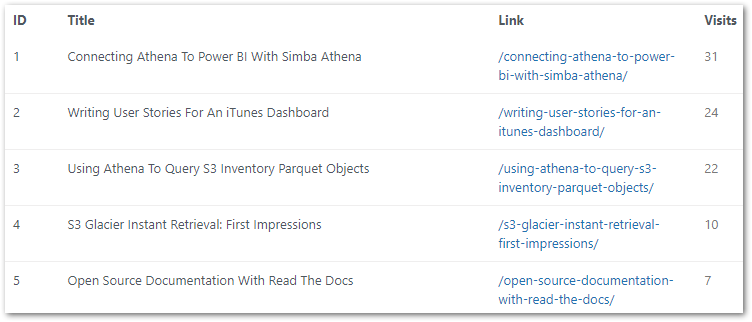
The query results were:

uritotal count
/connecting-athena-to-power-bi-with-simba-athena/31
/writing-user-stories-for-an-itunes-dashboard/24
/using-athena-to-query-s3-inventory-parquet-objects/22
/s3-glacier-instant-retrieval-first-impressions/10
/open-source-documentation-with-read-the-docs/ 7

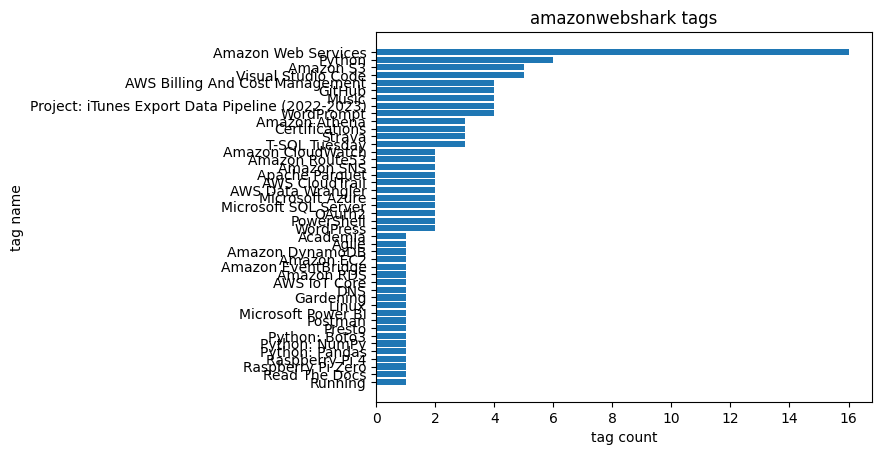
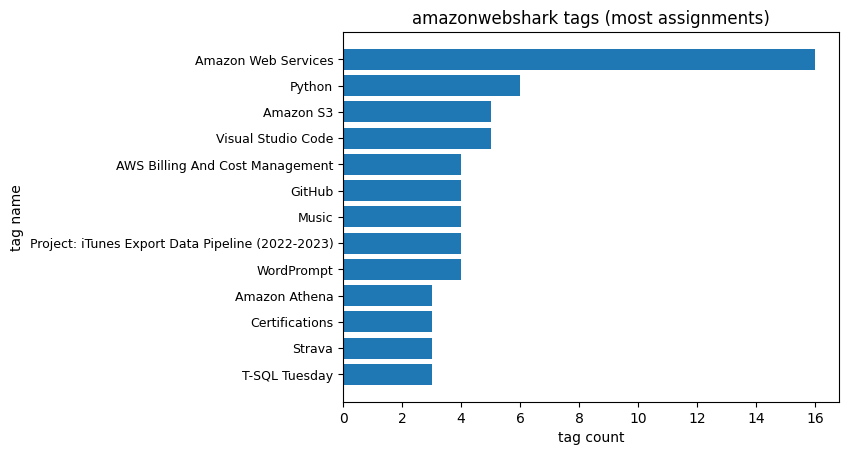
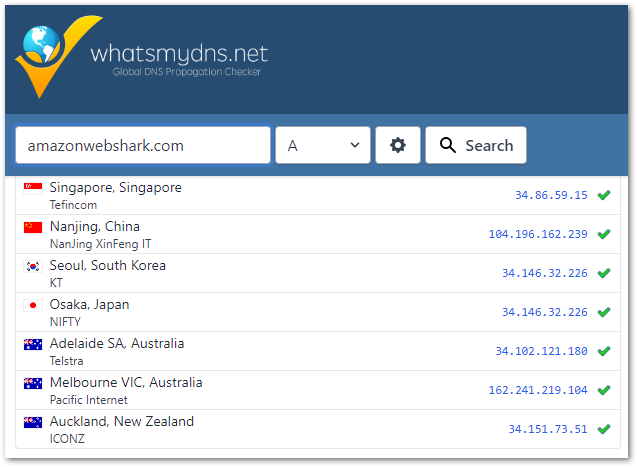
I compared these with my WPStatistics Pages report:

2023 02 16 WPStatisticsTopPagesChart

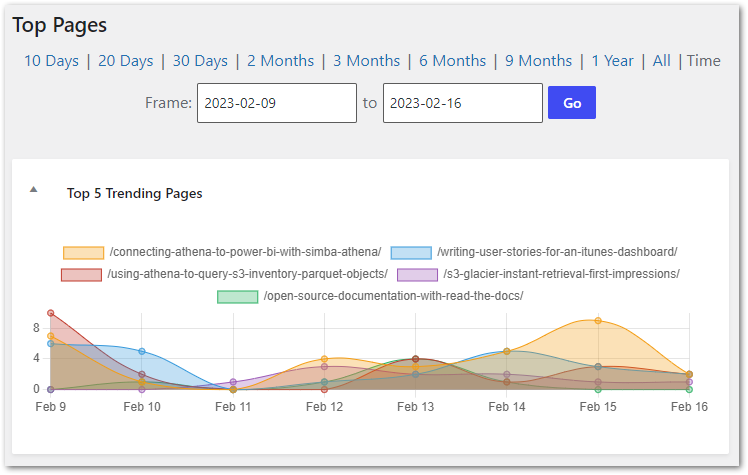
And the results were the same!

2023 02 16 WPStatisticsTopPagesTable

Pricing

In this section, I examine OpenAI’s usage and billing services.

Tokens

OpenAI uses the concept of tokens to calculate pricing. In their words:

The GPT family of models process text using tokens, which are common sequences of characters found in text. The models understand the statistical relationships between these tokens, and excel at producing the next token in a sequence of tokens.

OpenAI Tokenizer site

And:

“You can think of tokens as pieces of words used for natural language processing. For English text, 1 token is approximately 4 characters or 0.75 words. As a point of reference, the collected works of Shakespeare are about 900,000 words or 1.2M tokens.”

OpenAI Pricing site

OpenAI currently offers several tools for determining pricing:

OpenAI also operates a free tier. New users get $18 worth of free tokens. These expire after 3 months, after which accounts can be upgraded to paid plans operating on a pay-as-you-go basis. At this point, accounts with no billing information can still be accessed but no further API requests will be granted.

Usage

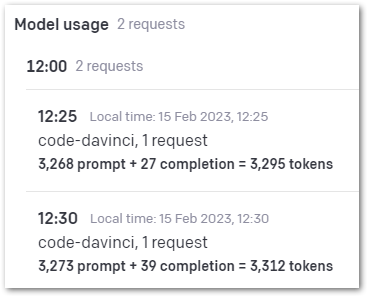
Here is my OpenAI usage for 2023-02-15:

2023 02 16 OpenAIBilling20230215

And 2023-02-16:

2023 02 16 OpenAIBilling20230216

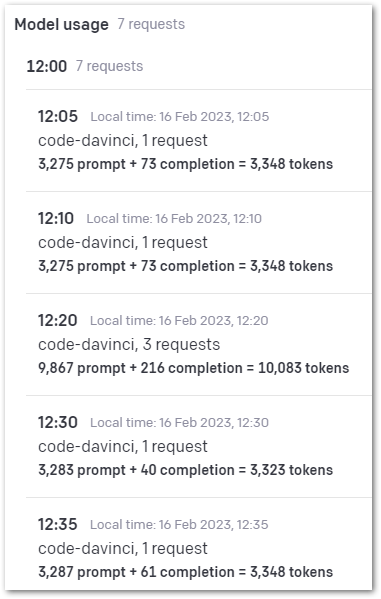
To understand this better, let’s examine the last row that relates to Test 3. The values stated are:

  • 3284 prompt tokens.
  • 61 completion tokens.

The Completion value is easy to verify. Entering ChatGPT’s Test 3 completion into the tokenizer site scores it at 61 tokens:

2023 02 16 OpenAITokenizer

Now let’s examine the Prompt value. When I enter my Test 3 prompt into the tokenizer site, it only scores it at 25 tokens. I wanted to see where the other 3259 tokens came from, so I needed to see what DBeaver sent to ChatGPT.

Currently, my OpenAI account doesn’t keep a record of what their APIs send and receive. However, I can log what DBeaver sends to OpenAI! This is done by enabling the Write GPT queries to debug log option in DBeaver’s ChatGPT settings.

It turns out that DBeaver includes DDL statements for all of the tables and columns in my amazonwebshark MySQL database in every ChatGPT prompt. Even in cases like Test 3 where I tell ChatGPT which table to use!

This isn’t unreasonable, as ChatGPT’s information retention is limited and it can’t access past conversations to inform its responses. But this explains the high prompt values per request. The OpenAI tokeniser says Test 3’s full prompt is 8293 characters. And remember – every 4 characters requires 1 token!

Addendum: DBeaver version 22.3.5 added metadata scope configuration to their ChatGPT smart completion.

In terms of size, my amazonwebshark MySQL database has around 20 tables with modest column counts. Larger databases with dozens of tables and potentially hundreds of columns could quickly rack up high usage fees, so use caution in these situations.

Billing

OpenAI has features to help with billing. Their site stores payment methods and shows invoices from the past 12 months. In addition, preferences like additional email addresses for billing notifications and business tax ID retention can be specified.

Accounts can also have usage limits, triggering notification emails when reached. These work alongside the usage tracking dashboard to help monitor spending.

So how much have I spent here?

By default, DBeaver uses the DaVinci model. This is currently listed at $0.0200 per 1000 tokens. If I take the 30,057 total tokens I’ve used and price them at $0.0200 per 1000 tokens, I get $0.60114.

In GBP that’s about £0.50 (or about 5p per query) which my free tier will cover.

Summary

In this post, I installed the new DBeaver OpenAI ChatGPT integration, tried it out with some prompts and examined the OpenAI usage costs.

Overall I was very impressed with what I found! ChatGPT works really well with a well-engineered prompt. It understood what I wanted and worked quickly. Would I pay for it? I think so, provided I kept an eye on the prompts being sent and the resulting usage costs.

In a future version, I’d like to be able to control what database metadata is included in a prompt. This would let me make sure that ChatGPT wasn’t getting sensitive or unnecessary metadata, and the smaller prompts would reduce my API usage costs.

Addendum: DBeaver version 22.3.5 added metadata scope configuration to their ChatGPT smart completion.

This is all very exciting though! I’m interested to discover how else the DBeaver OpenAI ChatGPT integration can help me out, and fascinated to see future developments!

If this post has been useful, please feel free to follow me on the following platforms for future updates:

Thanks for reading ~~^~~

Categories
Data & Analytics

1st Birthday MySQL Data Analysis With DBeaver & Python

In this post, I celebrate amazonwebshark’s 1st birthday with an analysis of my site’s MySQL data using DBeaver, Python and Matplotlib.

Table of Contents

Introduction

amazonwebshark is one year old today!

PXL 20221230 170232698 800600

To mark the occasion, I decided to examine the MySQL database that WordPress uses to run amazonwebshark, and see what it could tell me about the past twelve months.

In addition, I’ve been trying out DataCamp and have recently finished their Intermediate Python course. It introduced me to Matplotlib, and this post is a great chance to try out those new skills!

Timeline

I’ll start by answering a question. Why is amazonwebshark’s birthday on January 09 when my first post’s publication date is December 02 2021?

In response, here’s a brief timeline of how amazonwebshark came to be:

09 January 2022 was the first day that everything was fully live, so I view that as amazonwebshark’s birthday.

The three LinkedIn posts were added here on 19 January 2022, but without Introducing amazonwebshark.com they would never have left LinkedIn!

WordPress Database

In this section, I take a closer look at amazonwebshark’s MySQL database and the ways I can access it.

Database Schema

A WordPress site has lots to keep track of, like logins, plugins and posts. For this, it uses the MySQL database management system.

A standard WordPress installation creates twelve MySQL tables. WordPress describes them in its documentation, which includes this entity relationship diagram:

Additionally, DeliciousBrains have produced an Ultimate Developer’s Guide to the WordPress Database which gives a full account of each table’s columns and purpose.

SiteGround Portal Database Access

WordPress databases are usually accessed with phpMyAdmin – a free tool for MySQL admin over the Internet.

WPBeginner has a Beginner’s Guide To WordPress Database Management With phpMyAdmin, covering topics including restoring backups, optimisation and password resets.

While phpMyAdmin is great for basic maintenance, it’s not very convenient for data analysis:

  • There are no data tools like schema visualization or query plans.
  • It lacks scripting tools like IntelliSense or auto-complete.
  • Accessing it usually involves accessing the web host’s portal first.

Ideally, I’d prefer to access my database remotely using a SQL client instead. While this needs some additional config, SiteGround makes this very simple!

Remote Database Access

By default, SiteGround denies any remote access requests. Many people will never use this feature, so disabling it is a good security measure. Remote access is enabled in the SiteGround portal, which grants immediate remote access for specified IPs and hostnames.

After doing that, I created a new database user with read-only (SELECT) access to the MySQL database:

2023 01 01 SiteGroundMySQLPermissions

This isn’t strictly necessary, but the default user has unlimited access and violates the principle of least privilege in this situation.

The following SiteGround video demonstrates enabling remote access:

Analysis Tools

In this section, I examine the various tools I’ll use for amazonwebshark’s 1st birthday data analysis.

DBeaver

DBeaver is a free database tool and SQL client. It is multi-platform, open-source and supports a variety of databases including Microsoft SQL Server, Amazon Athena and MySQL.

DBeaver’s features include:

This VK Tech 360 video demonstrates connecting DBeaver to a local MySQL database:

mysql-connector-python

mysql-connector-python is a free Python driver for communicating with MySQL.

This Telusko video shows mysql-connector-python being used to access a local MySQL database:

mysql-connector-python is on PyPi and is installable via pip:

pip install mysql-connector-python

After mysql-connector-python is installed and imported, a connection to a MySQL database can be made using the mysql.connector.connect() function with the following arguments:

  • host: Hostname or IP address of the MySQL server.
  • database: MySQL database name.
  • user: User name used to authenticate with the MySQL server.
  • password: Password to authenticate the user with the MySQL server.

This opens a connection to the MySQL server and creates a connection object. I store this in the variable conn_mysql:

import mysql.connector

conn_mysql = mysql.connector.connect(
	host = var.MYSQL_HOST,
	database = var.MYSQL_DATABASE,
	user = var.MYSQL_USER,
	password = var.MYSQL_PASSWORD
	)

I have my credentials stored in a separate Python script that is imported as var. This means I can protect them via .gitignore until I get something better in place!

After that, I need a cursor for running my SQL queries. I create this using the cursor() method of my conn_mysql connection object and store the whole thing as cursor:

cursor = conn_mysql.cursor()

I’m now in a position to start running SQL queries from Python. I import a SQL query from my var script (in this case my Category query) and store it as query:

query = var.QUERY_CATEGORY

I then run my query using the execute() method. I get the results as a list of tuples using the fetchall() method, which I store as results:

cursor.execute(query)
results = cursor.fetchall()

Finally, I disconnect my cursor and MySQL connection with the close() method:

cursor.close()
conn_mysql.close()

Matplotlib

Matplotlib is a library for creating visualizations in Python. It can produce numerous plot types and has a large gallery of examples.

This BlondieBytes video shows a short demo of Matplotlib inside a Jupyter Notebook:

Matplotlib is on PyPi and is installable via pip:

pip install matplotlib

To view Matplotlib’s charts in Visual Studio Code I had to use an interactive window. Visual Studio Code has several options for this. Here I used the Run Current File In Interactive Window option, which needed the IPyKernel package to be installed in my Python virtual environment first.

Categories Analysis

In this section, I begin amazonwebshark’s 1st birthday data analysis by writing a SQL query for amazonwebshark’s categories and analysing the results with Python.

Categories Analysis: SQL Query

For my Category SQL query, I’ll be using the terms and term_taxonomy tables:

2023 01 07 WordPressTables

WordPress has a taxonomy system for content organization. Individual taxonomy items are called terms, and they are stored in the terms table. Terms for amazonwebshark include Data & Analytics and Security & Monitoring.

The term_taxonomy table links a term_id to a taxonomy, giving context for each term. Common taxonomies are category, post_tag and nav_menu.

If I join these tables on term_id then I can map terms to taxonomies. In the following query results, the first two columns are from terms and the rest are from term_taxonomy:

2023 01 07 DBeaverQuery

My final query keeps the join, cleans up terms.name, returns all categories with at least one use and orders the results by term_taxonomy.count and terms.name:

SELECT
	REPLACE (t.name, '&', '&') AS name,
	tt.count
FROM
	term_taxonomy AS tt
INNER JOIN terms AS t ON
	tt.term_id = t.term_id
WHERE
	tt.taxonomy = 'category'
	AND tt.count > 0
ORDER BY
	tt.count ASC ,
	t.name DESC
2023 01 04 DBeaverCategoryResults

In future, I’ll need to limit the results of this query to a specific time window. Here, I want all the results so no further filtering is needed.

Categories Analysis: Python Script

Currently, my results variable contains the results of the var.QUERY_CATEGORY SQL query. When I run print(results), I get this list of tuples:

[('Training & Community', 1), ('DevOps & Infrastructure', 1), ('AI & Machine Learning', 1), ('Internet Of Things & Robotics', 2), ('Architecture & Resilience', 2), ('Security & Monitoring', 3), ('Me', 4), ('Data & Analytics', 5), ('Developing & Application Integration', 8)]

So how do I turn this into a graph? Firstly, I need to split results up into what will be my X-axis and Y-axis. For this, I create two empty lists called name and count:

name = []
count = []

After that, I populate the lists by looping through result. For each tuple, the first item is appended to name and the second is appended to count:

for result in results:
    name.append(result[0])
    count.append(result[1])

When I print the lists now, name and count contain the names and counts from the SQL query in the same order as the original results:

print(f'name = {name}')
name = ['Training & Community', 'DevOps & Infrastructure', 'AI & Machine Learning', 'Internet Of Things & Robotics', 'Architecture & Resilience', 'Security & Monitoring', 'Me', 'Data & Analytics', 'Developing & Application Integration']
print(f'count = {count}')
count = [1, 1, 1, 2, 2, 3, 4, 5, 8]

I then use these lists with Matplotlib, imported as plt:

plt.bar(name, count)
plt.xlabel("category name")
plt.ylabel("category count")
plt.title("amazonwebshark categories")
plt.show()
  • bar sets the visual’s type as a bar chart. The X-axis is name and the Y-axis is count.
  • xlabel labels the X-axis as category name
  • ylabel labels the Y-axis as category count.
  • title names the chart as amazonwebshark categories
  • show shows the graph.

The following chart is produced:

sharkbirth category bar

However, the X-axis labels are unreadable. I can fix this by changing my script:

plt.barh(name, count)
plt.xlabel("count")
plt.ylabel("name")
plt.title("amazonwebshark categories")
plt.show()

I use barh to change the graph to a horizontal bar chart, and then swap the xlabel and ylabel strings around. This time the chart is far easier to read:

sharkbirth category barh

Tags Analysis

In this section, I continue amazonwebshark’s 1st birthday data analysis by writing a SQL query for amazonwebshark’s tags and analysing the results with Python.

Tags Analysis: SQL Query

My Tags SQL query is almost the same as my Categories one. This time, my WHERE clause is filtering on post_tag:

SELECT
	REPLACE (t.name, '&', '&') AS name,
	tt.count
FROM
	term_taxonomy AS tt
INNER JOIN terms t ON
	tt.term_id = t.term_id
WHERE
	tt.taxonomy = 'post_tag'
	AND tt.count > 0
ORDER BY
	tt.count ASC ,
	t.name DESC

There are more results this time. While I try to limit my use of categories, I’m currently using 44 tags:

2023 01 04 DBeaverTagsResults

Tags Analysis: Python Script

My Tags Python script is (also) almost the same as my Categories one. This time, the query variable has a different value:

query = var.QUERY_TAG

So print(results) returns a new list of tuples:

[('Running', 1), ('Read The Docs', 1), ('Raspberry Pi Zero', 1), ('Raspberry Pi 4', 1), ('Python: Pandas', 1), ('Python: NumPy', 1), ('Python: Boto3', 1), ('Presto', 1), ('Postman', 1), ('Microsoft Power BI', 1), ('Linux', 1), ('Gardening', 1), ('DNS', 1), ('AWS IoT Core', 1), ('Amazon RDS', 1), ('Amazon EventBridge', 1), ('Amazon EC2', 1), ('Amazon DynamoDB', 1), ('Agile', 1), ('Academia', 1), ('WordPress', 2), ('PowerShell', 2), ('OAuth2', 2), ('Microsoft SQL Server', 2), ('Microsoft Azure', 2), ('AWS Data Wrangler', 2), ('AWS CloudTrail', 2), ('Apache Parquet', 2), ('Amazon SNS', 2), ('Amazon Route53', 2), ('Amazon CloudWatch', 2), ('T-SQL Tuesday', 3), ('Strava', 3), ('Certifications', 3), ('Amazon Athena', 3), ('WordPrompt', 4), ('Project: iTunes Export Data Pipeline (2022-2023)', 4), ('Music', 4), ('GitHub', 4), ('AWS Billing And Cost Management', 4), ('Visual Studio Code', 5), ('Amazon S3', 5), ('Python', 6), ('Amazon Web Services', 16)]

Matplotlib uses these results to produce another horizontal bar chart with a new title:

plt.barh(name, count)
plt.xlabel("count")
plt.ylabel("name")
plt.title("amazonwebshark tags")
plt.show()

But this chart has a different problem – the Y-axis is unreadable because of the number of tags returned by my SQL query:

sharkbirth tag all

To fix this, I reduce the number of rows returned by changing my SQL WHERE clause from:

WHERE
	tt.taxonomy = 'post_tag'
	AND tt.count > 0

to:

WHERE
	tt.taxonomy = 'post_tag'
	AND tt.count > 2

This returns a smaller list of tuples:

[('T-SQL Tuesday', 3), ('Strava', 3), ('Certifications', 3), ('Amazon Athena', 3), ('WordPrompt', 4), ('Project: iTunes Export Data Pipeline (2022-2023)', 4), ('Music', 4), ('GitHub', 4), ('AWS Billing And Cost Management', 4), ('Visual Studio Code', 5), ('Amazon S3', 5), ('Python', 6), ('Amazon Web Services', 16)]

I then update the title to reflect the new results and use yticks to reduce the Y-axis label font size to 9:

plt.barh(name, count)
plt.xlabel("tag count")
plt.ylabel("tag name")
plt.title("amazonwebshark tags (most assignments)")
plt.yticks(fontsize = 9)
plt.show()

The chart is now more useful and easier to read:

sharkbirth tag most

Views Analysis

I also planned to analyse my post views here. But, as I mentioned in my last post, some of this data is missing! So any chart will be wrong.

I haven’t had time to look at this yet, so stay tuned!

Summary

In this post, I celebrated amazonwebshark’s 1st birthday with an analysis of my site’s MySQL data using DBeaver, Python and Matplotlib.

I had fun researching and writing this! It can be tricky to find a data source that isn’t contrived or overused. Having access to the amazonwebshark database gives me data that I’m personally invested in, and an opportunity to practise writing MySQL queries.

I’ve also been able to improve my Python, and meaningfully experiment with Matplotlib to get charts that will be useful going forward. For example, I used the very first Tags chart to prune some unneeded tags from my WordPress taxonomy.

If this post has been useful, please feel free to follow me on the following platforms for future updates:

Thanks for reading ~~^~~

Categories
DevOps & Infrastructure

Migrating amazonwebshark To SiteGround

In this post, I examine the process of migrating amazonwebshark to SiteGround and give an overview of the processes involved.

Table of Contents

Introduction

When I started amazonwebshark I had to make some infrastructure decisions. I registered the domain name with Amazon Route 53, and then needed to choose a blog hosting platform.

In December 2021 I took advantage of a Bluehost offer and paid £31.90 for their Basic WordPress Hosting package. This included a variety of services including:

My Bluehost renewal came through earlier this month, priced at £107.76. I’ve had great service from Bluehost and have no complaints, but that price was quite a leap. So, before I accepted it, I decided to do some research and see what my alternatives were.

Hosting Alternatives

In this section, I go through the results of my research into alternative hosting platforms.

Amazon Lightsail

I started by looking at Amazon Lightsail. Essentially, Lightsail is a simplified way of deploying AWS services like EC2, EBS and Elastic Load Balancing.

Lightsail pricing differs from most AWS services. Instead of the common Pay-As-You-Go pricing model, Lightsail has set monthly pricing. For example, a Linux server with similar memory, processing and storage to my Bluehost server currently costs $3.50 a month.

There is an important difference though. While Bluehost has teams of people responsible for tasks like server maintenance, database recovery, hard disk failures and security patches, with Lightsail the infrastructure would become my responsibility. I would save money over Bluehost, but at the cost of doing my own systems admin.

And the above list isn’t even exhaustive! It doesn’t include the setup and maintenance of services like CDN, SSL certificates and email accounts, all of which come with their own extra requirements and costs.

At this point, Bluehost was still on top.

SiteGround

SiteGround is in the same business as Bluehost. It offers a variety of hosting solutions for an array of use cases and has good standing in the industry.

SiteGround also had a great Black Friday offer this year! It was offering pretty much the same deal as Bluehost at £1.99 a month:

2022 11 25 SitegroundOfferScroll

This is INSANELY cheap, especially considering how much all this infrastructure costs to run!

SiteGround has also developed a free WordPress plugin to automate migrations from other hosting platforms. While this isn’t unique to them, a combination of good reviews, extensive services, low hassle and a great price was more than enough to get me on board.

Migrate What Exactly?

Before continuing, I thought it best to go into a bit of detail about what exactly is being migrated. I’ve mentioned servers, databases and domains, but what gets moved where? And why?

Well, because I’m moving things around on the Internet, I need to talk about the Domain Name System (DNS).

Wait! Come back!

Explain DNS Like I’m 5

What follows is a very simple introduction to DNS. There’s far more to DNS than this, but that’s beyond the scope of this post.

Let’s say I want to phone The Shark Trust. I can’t type “The Shark Trust” into my handset – I need their phone number. So I open my phone book, turn to the S section and find The Shark Trust. Next to this entry is a phone number: 01752 672008. I type that number into the handset and get through to their office.

DNS is like the Internet’s phone book. Websites are held on servers, and the ‘phone numbers’ for those servers are IP addresses. When I request a website like amazonwebshark.com, my web browser needs to know the IP address for the server holding the site’s data, for example 34.91.95.18.

Explain DNS With Pictures

This WebDeasy diagram show DNS at a high level:

WebDeasy: How the Domain Name System (DNS) works – Basics

When a URL is entered into a web browser, a query is sent to a DNS server. Using the phone book analogy, the web browser is asking the DNS server for the amazonwebshark.com phone number.

DNS servers don’t have any IP addresses, but they know which ‘phone book’ to look in. These ‘phone books’ are called name servers. The DNS server finds and contacts the right name server, which matches the amazonwebshark.com domain name to an IP address.

The DNS server then returns this IP address to the web browser, which uses it to contact the server hosting the amazonwebshark.com resources.

In the diagram, the DNS-Server represents Route 53. Route 53 holds DNS records for the amazonwebshark.com domain name, and knows where to find the name servers that have the amazonwebshark.com IP address.

The webdeasy.de server represents the Bluehost name servers. These servers can answer a variety of DNS queries, and are considered the ground truth for initial site visits and browser caching.

amazonwebshark’s DNS Setup

At the start of December 2022 the amazonwebshark.com domain name was hosted by Route 53, with an NS record pointing at the Bluehost name servers:

2022 12 02 Route53Bluehost

The basic infrastructure looked like this, with outbound requests in blue and inbound responses in green:

2022 12 27 amazonwebsharkDNSdiagram

And that’s it! To further explore DNS core concepts, this DNSimple comic is well worth a read and this Fireship video gives a solid, if a little more technical, account:

Data Migration

In this section, I start migrating my amazonwebshark data from Bluehost to SiteGround.

SiteGround has an automated migrator plugin that copies existing WordPress sites from other hosting platforms. And it’s very good! The process boils down to:

The process can also be seen in this Avada video:

The plugin copies all the amazonwebshark server files, scripts and database objects in a process that takes about five minutes. SiteGround then provides a temporary URL for testing and performance checks:

2022 12 02 SiteGroundMigratonComplete

After completely migrating amazonwebshark to SiteGround, the next step involves telling the amazonwebshark domain where to find the new server. Time for some DNS!

DNS Migration

In this section, I update the amazonwebshark DNS records with the SiteGround name servers.

I repointed the existing amazonwebshark NS record from Bluehost to SiteGround by updating the values in Route 53 from this:

2022 12 02 Route53Bluehost

To this:

2022 12 02 Route53SiteGround

My change then needed to propagate through the Internet. Internet Service Providers update their records at different rates, so changes can take up to 72 hours to complete worldwide.

Free DNS checking tools like WhatIsMyDNS can perform global checks on a domain name’s IP address and DNS record information. The check below was done after around 30 hours, by which time most of the servers were returning SiteGround IPs:

2022 12 06 DNSPropagationCheck

Any Problems?

First, the good news. There was no downtime while migrating amazonwebshark to SiteGround! During the migration, DNS queries were resolved by either Bluehost’s or SiteGround’s name servers. Both platforms had amazonwebshark data, so both could answer DNS queries.

Additionally, as I set a change freeze on amazonwebshark until the migration was over, there was no lost or orphaned content.

I did lose some WPStatistics hit statistics data though. There is no data for December 03 and December 04:

2022 12 18 WPStatisticsHits

This was my fault. The DNS propagation took longer than it should have because of a misunderstanding on my part!

So why was data lost? WPStatistics stores data in tables in the site’s MySQL database. When I first migrated my data on December 02, the Bluehost and SiteGround tables were the same. After that point, Bluehost continued to serve amazonwebshark until December 05, and wrote its statistics in the Bluehost MySQL tables.

It was only after I corrected my DNS mistake that SiteGround could start serving content and writing statistics on the SiteGround MySQL tables. So SiteGround didn’t record anything for December 03 and December 04, and as no additional data migration was done the statistics that Bluehost recorded never made it to the SiteGround tables.

I can recover this if I want to though. I took a full backup of my Bluehost data before ending the contract. That included a full backup of the Bluehost MySQL database with the WPStatistics tables. I’ll take a look at the tables at some point, see how the data is arranged and decide from there.

Future Plans

I’m considering moving amazonwebshark to a serverless architecture in 2023. While the migration was a success, servers still have inherent problems:

  • Servers can break or go offline.
  • They can be hacked.
  • They can be over or under-provisioned.

Serverless infrastructure could remove those pain points. I don’t use any WordPress enterprise features, and amazonwebshark could exist very well as an event-driven static website. Tools like Hugo and Jekyll are designed for the job and documented well, and people like Kendra Little and Chrissy LeMaire have successfully transitioned their blogs to serverless infrastructures.

The biggest challenge here isn’t architectural. If I moved to a serverless architecture, I would want something similar to the Yoast SEO analysis plugin. This plugin has really helped me improve my posts, and by extension has made them more enjoyable to write.

I’ve seen lots of serverless tooling for migrating resources and serving content, but not so much for SEO guidance and proofreading. Any amazonwebshark serverless migration would be contingent on finding something decent along these lines. After all, if the blog becomes a pain to write for then what’s the point?

Summary

In this post, I examined the process of migrating amazonwebshark to SiteGround and gave an overview of the processes involved.

I’m very happy with how things went overall! The heavy lifting was done for me, both companies were open and professional throughout and what could have been a daunting process was made very simple!

If this post has been useful, please feel free to follow me on the following platforms for future updates:

Thanks for reading ~~^~~