Categories
Data & Analytics

SQL Workbench: On-Demand DuckDB-Wasm With No Bill

In this post, I try Tobias Müller‘s free SQL Workbench tool powered by DuckDB-Wasm. And maybe make one or two gratuitous duck puns.

Table of Contents

Introduction

Hopefully like many people in tech, I have a collection of articles, repos, projects and whatnot saved under the banner of “That sounds cool / looks interesting / feels useful – I should check that out at some point.” Sometimes things even come off that list…

DuckDB was on my list, and went to the top when I heard about Tobias Müller’s free SQL Workbench tool powered by DuckDB-Wasm. What I heard was very impressive and pushed me to finally examine DuckDB up close.

So what is DuckDB?

About DuckDB

This section examines DuckDB and DuckDB-Wasm – core components of SQL Workbench.

DuckDB

DuckDB is an open-source SQL Online Analytical Processing (OLAP) database management system. It is intended for analytical workloads, and common use cases include in-process analytics, exploration of large datasets and machine learning model prototyping. DuckDB was released in 2019 and reached v1.0.0 on June 03 2024.

DuckDB is an embedded database that runs within a host process. It is lightweight, portable and requires no separate server. It can be embedded into applications, scripts, and notebooks without bespoke infrastructure.

DuckDB uses a columnar storage format and supports standard SQL features like complex queries, joins, aggregations and window functions. It can be used with programming languages like Python and R.

In this Python example, DuckDB:

  • Creates an in-memory database
  • Defines a users table.
  • Inserts data into users.
  • Runs a query to fetch results.
Python
import duckdb

# Create a new DuckDB database in memory
con = duckdb.connect(database=':memory:')

# Create a table and insert some data
con.execute("""
CREATE TABLE users (
    user_id INTEGER,
    user_name VARCHAR,
    age INTEGER
);
""")

con.execute("INSERT INTO users VALUES (1, 'Alice', 30), (2, 'Bob', 25), (3, 'Charlie', 35)")

# Run a query
results = con.execute("SELECT * FROM users WHERE age > 25").fetchall()
print(results)

DuckDB-Wasm

Launched in 2021, DuckDB WebAssembly (Wasm) is a version of the DuckDB database that has been compiled to run in WebAssembly. This lets DuckDB run in web browser processes and other environments with WebAssembly support.

So what’s WebAssembly? Don’t worry – I didn’t know either and so deferred to an expert:

Since all data processing happens in the browser, DuckDB-Wasm brings new benefits to DuckDB. In-browser dashboards and data analysis tools with DuckDB-Wasm enabled can operate without any server-side processing, improving their speed and security. If data is being sent somewhere then DuckDB-Wasm can handle ETL operations first, reducing both processing time and cost.

Running in-browser SQL queries also removes the need for setting up database servers and IDEs, reducing patching and maintenance (but don’t forget about the browser!) while increasing availability and convenience for remote work and educational purposes.

Like DuckDB, it is open-source and the code is on GitHub. A DuckDB Web Shell is available at shell.duckdb.org and there are also more technical details on DuckDB’s blog.

SQL Workbench

This section examines SQL Workbench and tries out some of its core features.

About SQL Workbench

Tobias Müller produced SQL Workbench in January 2024. He integrated DuckDB-Wasm into an AWS serverless static site and built an online interactive tool for querying data, showing results and generating visualizations.

SQL Workbench is available at sql-workbench.com. Note that it doesn’t currently support mobile browsers. Tobias has also written a great tutorial post that includes:

and loads more content in addition that I won’t reproduce here. So go and give Tobias some traffic!

Layout

The core SQL Workbench components are:

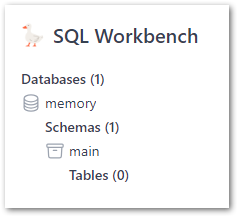
  • The Object Explorer section shows databases, schema and tables:
2024 06 26 SQLWorkbenchSchema
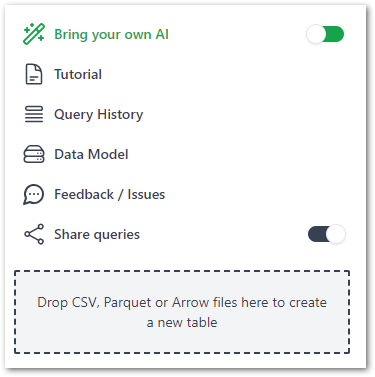
  • The Tools section shows links, settings and a drag-and-drop section for adding files (more on that later):
2024 06 26 SQLWorkbenchOptions
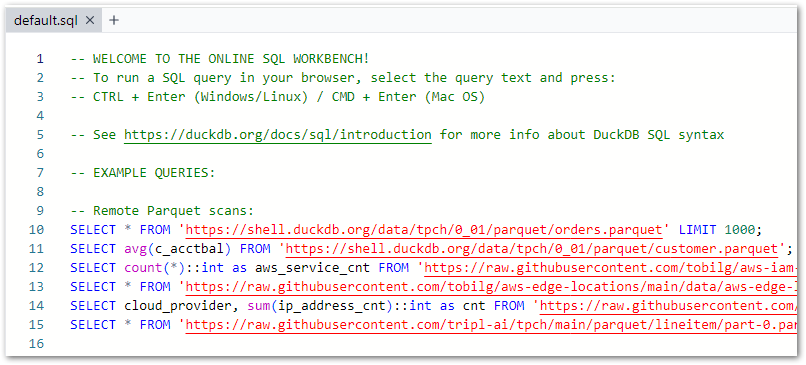
  • The Query Pane for writing SQL, which preloads with the below script upon each browser refresh:
2024 06 26 SQLWorkbenchQueryWindow
  • And finally, the Results Pane shows query results and visuals:
2024 06 26 SQLWorkbenchResultsWindow

Next, let’s try it out!

Sample Queries

SQL Workbench opens with a pre-loaded script that features:

  • Instructions:
SQL
-- WELCOME TO THE ONLINE SQL WORKBENCH!
-- To run a SQL query in your browser, select the query text and press:
-- CTRL + Enter (Windows/Linux) / CMD + Enter (Mac OS)

-- See https://duckdb.org/docs/sql/introduction for more info about DuckDB SQL syntax
  • Example queries using Parquet files:
SQL
-- Remote Parquet scans:
SELECT * FROM 'https://shell.duckdb.org/data/tpch/0_01/parquet/orders.parquet' LIMIT 1000;

SELECT avg(c_acctbal) FROM 'https://shell.duckdb.org/data/tpch/0_01/parquet/customer.parquet';

SELECT count(*)::int as aws_service_cnt FROM 'https://raw.githubusercontent.com/tobilg/aws-iam-data/main/data/parquet/aws_services.parquet';

SELECT * FROM 'https://raw.githubusercontent.com/tobilg/aws-edge-locations/main/data/aws-edge-locations.parquet';

SELECT cloud_provider, sum(ip_address_cnt)::int as cnt FROM 'https://raw.githubusercontent.com/tobilg/public-cloud-provider-ip-ranges/main/data/providers/all.parquet' GROUP BY cloud_provider;

SELECT * FROM 'https://raw.githubusercontent.com/tripl-ai/tpch/main/parquet/lineitem/part-0.parquet';
  • Example query using a CSV file:
SQL
-- Remote CSV scan
SELECT * FROM read_csv_auto('https://raw.githubusercontent.com/tobilg/public-cloud-provider-ip-ranges/main/data/providers/all.csv');

These queries are designed to show SQL Workbench’s capabilities and the style of SQL queries it can run (expanded on further here). They can also be used for experimentation, so here goes!

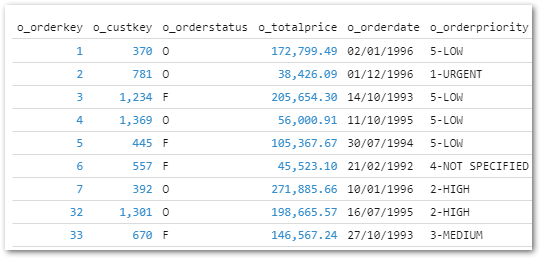
Firstly, I’ve added an ORDER BY to the first Parquet query to make sure the first 1000 orders are returned:

SQL
-- Show first 1000 orders for Parquet file
SELECT * 
FROM 'https://shell.duckdb.org/data/tpch/0_01/parquet/orders.parquet'
ORDER BY o_orderkey
LIMIT 1000;
2024 06 26 SQL WorkbenchQueryLimit1000

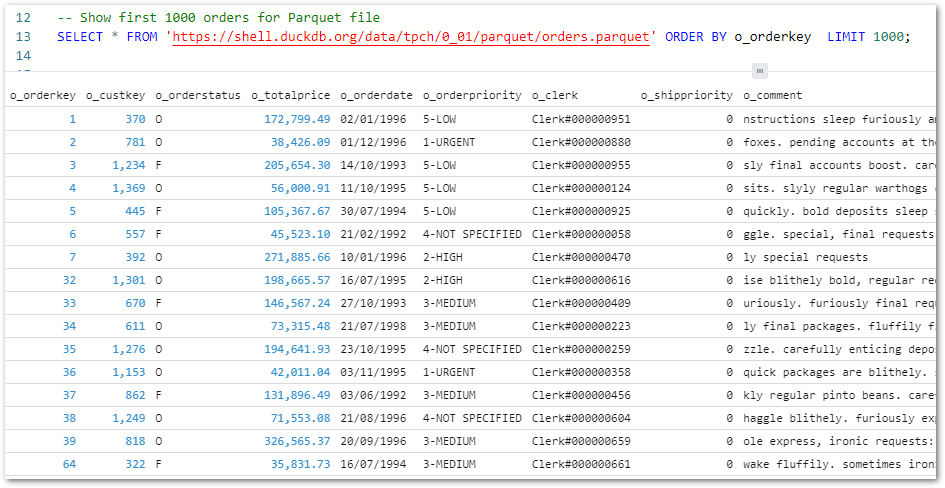
Secondly, I’ve used the COUNT and CAST functions to count the total orders and return the value as an integer:

SQL
-- Show number of orders for Parquet file
SELECT CAST(COUNT(o_orderkey) AS INT) AS orderkeycount 
FROM 'https://shell.duckdb.org/data/tpch/0_01/parquet/orders.parquet';
2024 06 26 SQL WorkbenchQueryOrderCount

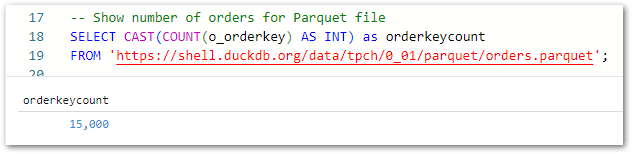
Finally, this query captures all 1996 orders in a CTE and uses it to calculate the 1996 order price totals grouped by order priority:

SQL
-- Show 1996 order totals in priority order
WITH cte_orders1996 AS (
    SELECT o_orderkey, o_custkey, o_totalprice, o_orderdate, o_orderpriority
    FROM 'https://shell.duckdb.org/data/tpch/0_01/parquet/orders.parquet'
    WHERE YEAR(o_orderdate) = 1996
)

SELECT SUM(o_totalprice) AS totalpriorityprice, o_orderpriority 
FROM cte_orders1996 
GROUP BY o_orderpriority 
ORDER BY o_orderpriority;
2024 06 26 SQL WorkbenchQueryCTE

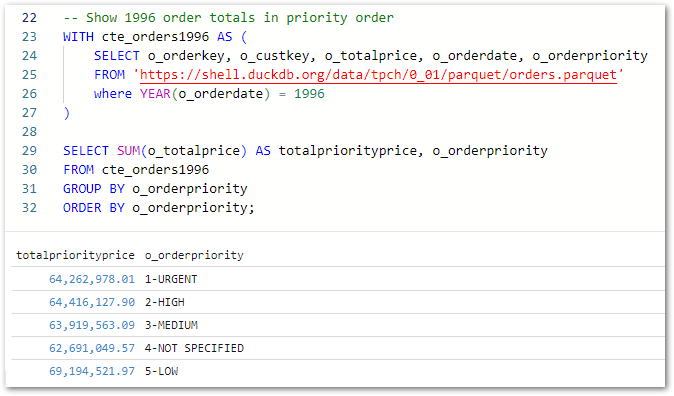
Now let’s try some of my data!

File Imports

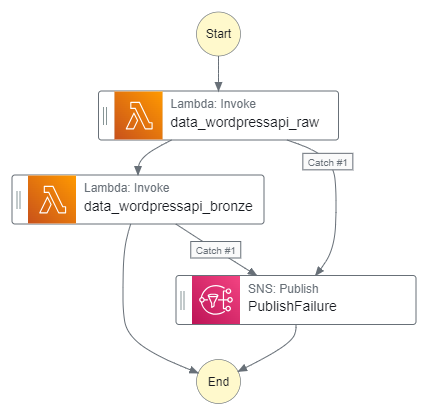
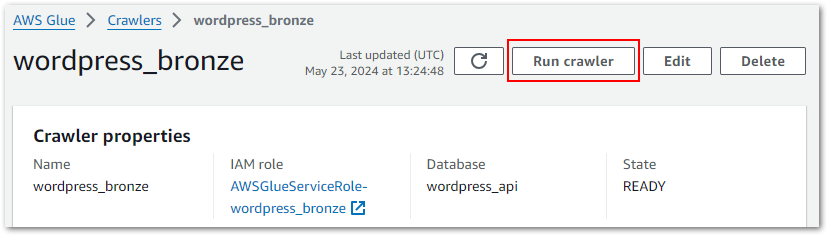
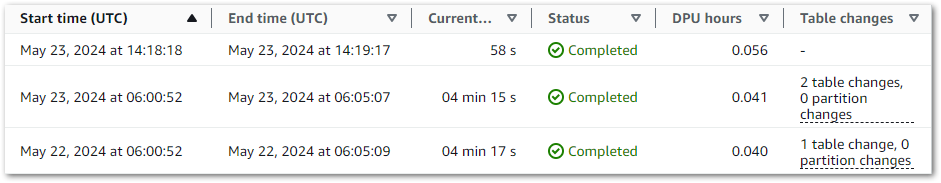
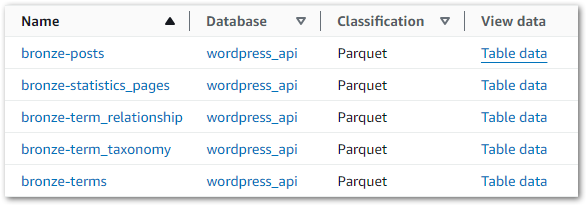
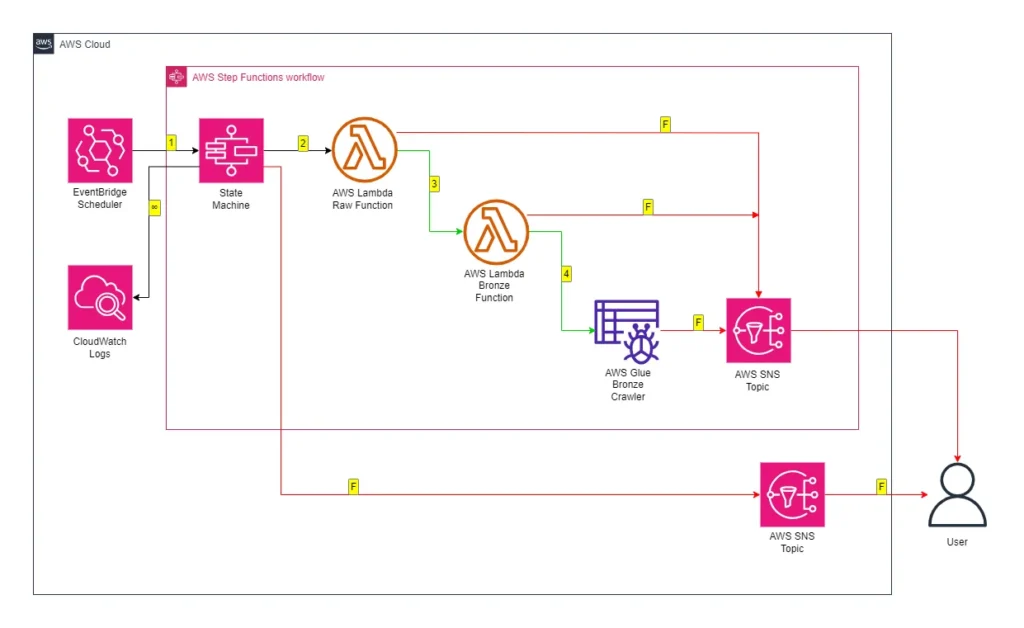
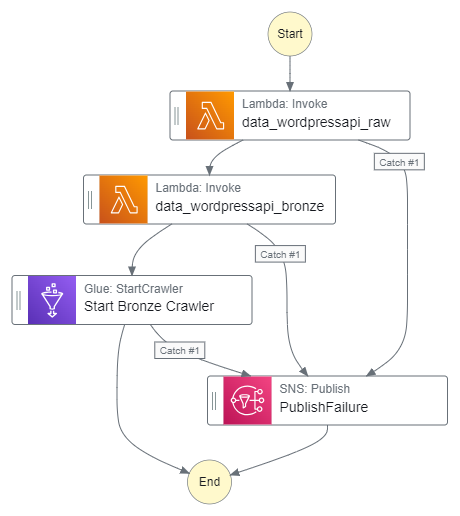
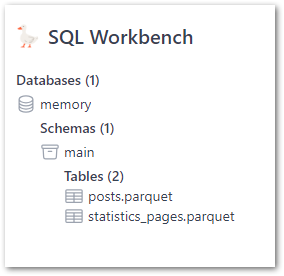
SQL Workbench can also query data stored locally (as well as remote data which is out of this post’s scope). For this section I’ll be using some Parquet files generated by my WordPress bronze data orchestration process: posts.parquet and statistics_pages.parquet.

After dragging each file onto the assigned section they quickly appear as new tables:

2024 06 26 SQLWorkbenchSchemaWordPress

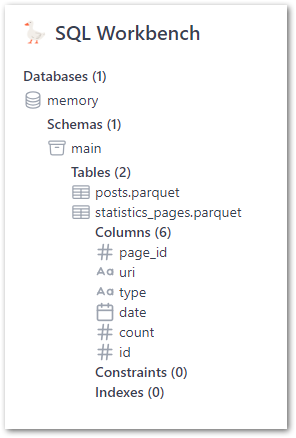
These tables show column names and inferred data types when expanded:

2024 06 26 SQLWorkbenchSchemaWordPressExpanded

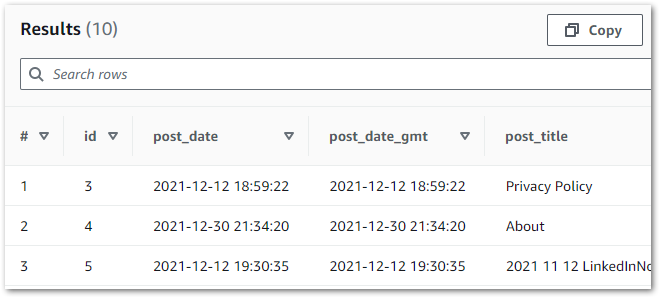
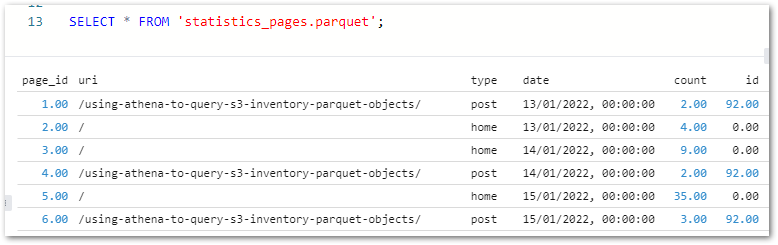
Queries can be written manually or by right-clicking the tables in the Object Explorer. A statistics_pages SELECT * test query shows the expected results:

2024 06 26 SQLWorkbenchQueryStatsPages

As posts.parquet‘s ID primary key column matches statistics_pages.parquet‘s ID foreign key column, the two files can be joined on this column using an INNER JOIN:

SQL
SELECT 
  p.post_title,
  sp.type, 
  sp.date as viewdate,
  sp.count
FROM 
  'statistics_pages.parquet' AS sp
  INNER JOIN 'posts.parquet' AS p ON sp.id = p.id
 ORDER BY sp.date
2024 06 26 SQLWorkbenchQueryJoin

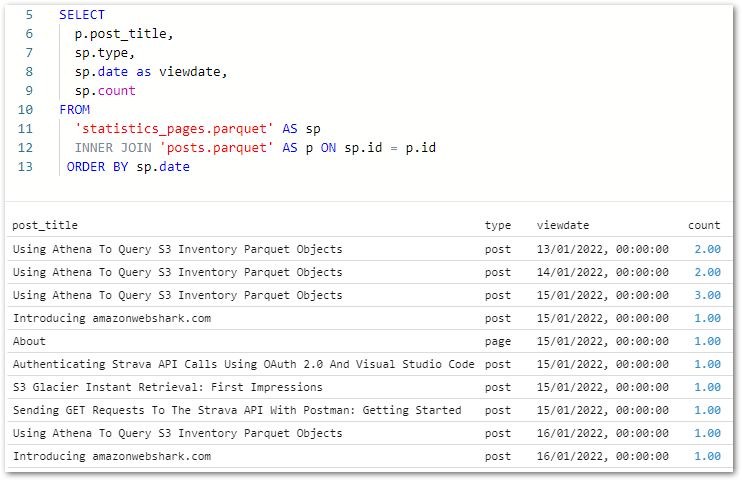
I can use this query to start making visuals!

Visuals

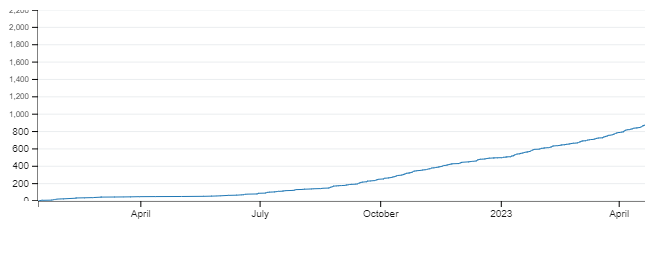
Next, let’s examine SQL Workbench’s visualisation capabilities. To help things along, I’ve written a new query showing the cumulative view count for my Using Athena To Query S3 Inventory Parquet Objects post (ID 92):

SQL
 SELECT 
  sp.date AS viewdate,
  SUM(sp.count) OVER (PARTITION BY sp.id ORDER BY sp.date) AS cumulative_views
FROM 
  'statistics_pages.parquet' AS sp
  INNER JOIN 'posts.parquet' AS p ON sp.id = p.id
WHERE p.id = 92
ORDER BY sp.date;
2024 06 26 SQLWorkbenchQueryCumulViews

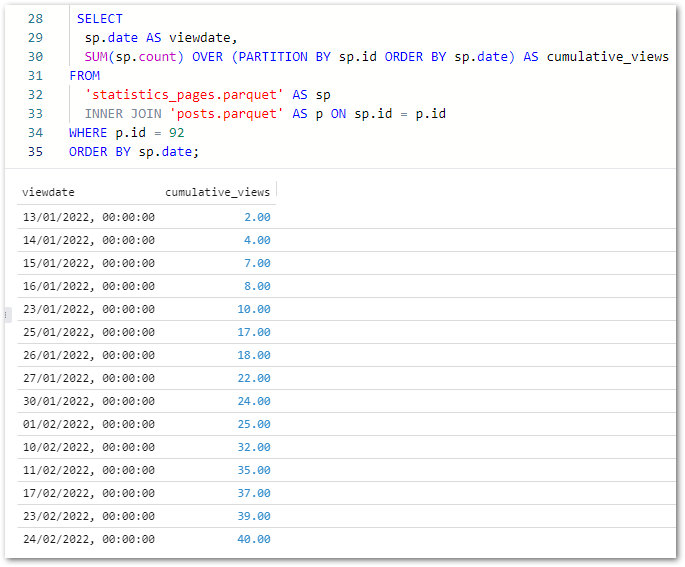
(On reflection the join wasn’t necessary for this output, but anyway… – Ed)

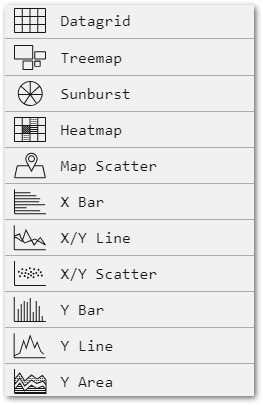
Tobias has written visualisation instructions here so I’ll focus more on how my visual turns out. After the query finishes running, several visual types can be selected:

2024 06 26 SQLWorkbenchVisualizationsOptions

Selecting a visual quickly renders it in the browser. Customisation options are also available. That said, in my case the first chart was mostly fine!

2024 06 26 SQLWorkbenchVisualizationsLineChart

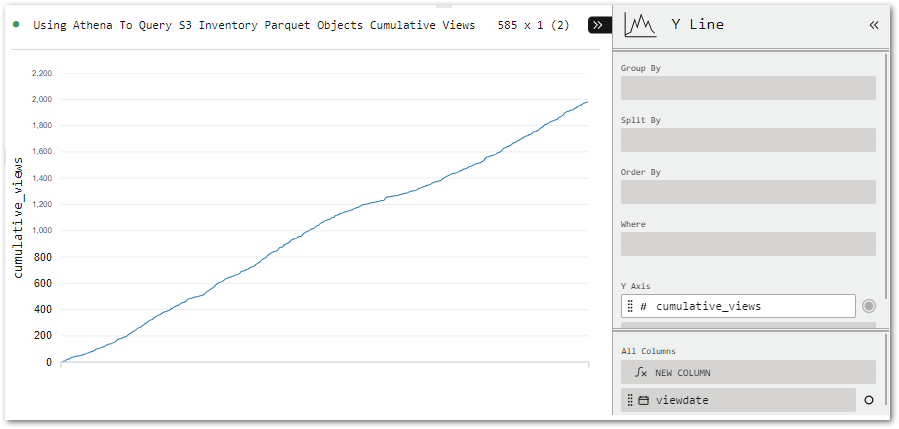
All I need to do is move viewdata (bottom right) to the Group By bin (top right) to add dates to the X-axis.

Exports & Cleanup

Finally, let’s examine SQL Workbench’s export options. And there’s plenty to choose from!

2024 06 26 SQLWorkbenchExports

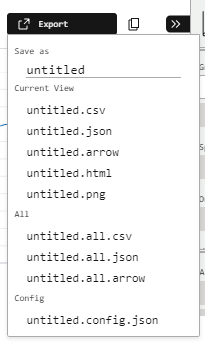
The CSV and JSON options export the query results in their respective formats. The Arrow option exports query results in Apache Arrow format, which is designed for high-speed in-memory data processing and so compliments DuckDB very well. Dremio wrote a great Arrow technical guide for those curious.

The HTML option produces an interactive graph with tooltips and configuration options. Handy for sharing and I’m sure there’ll be a way to use the backend code for embedding if I take a closer look. The PNG has me covered in the meantime, immediately producing this image:

athenainventorycumulativeCropped
(Image cropped for visibility – Ed)

Finally there’s the Config.JSON option, which exports the visual’s settings for version control and reproducibility:

JSON
{"version":"2.10.0","plugin":"Y Line","plugin_config":{},"columns_config":{},"settings":true,"theme":"Pro Light","title":"Using Athena To Query S3 Inventory Parquet Objects Cumulative Views","group_by":["viewdate"],"split_by":[],"columns":["cumulative_views"],"filter":[],"sort":[],"expressions":{},"aggregates":{}}

All done! So how do I remove my data from SQL Workbench? I…refresh the site! Because SQL Workbench uses DuckDB, my data has only ever been stored locally and in memory. This means the data only persists until the SQL Workbench page is closed or reloaded.

Summary

In this post, I tried Tobias Müller’s free SQL Workbench tool powered by DuckDB-Wasm.

SQL Workbench and DuckDB are both very impressive! The results they produce with no servers or data movement are remarkable, and their tooling greatly simplifies working with modern data formats.

DuckDB makes lots of sense as an AWS Lambda layer, and DuckDB-Wasm simplifies in-browser analytics at a time when being data-driven and latency-averse are constantly gaining importance. I don’t feel like I’ve even scratched the surface of SQL Workbench either, so go and check it out!

Phew – no duck puns. No one has time for that quack. If this post has been useful then the button below has links for contact, socials, projects and sessions:

SharkLinkButton 1

Thanks for reading ~~^~~

Categories
Data & Analytics

Discovering Data With AWS Glue

In this post, I use the data discovering features of AWS Glue to crawl and catalogue my WordPress API pipeline data.

Table of Contents

Introduction

By the end of my WordPress Bronze Data Orchestration post, I had created an AWS Step Function workflow that invokes two AWS Lambda functions:

stepfunctions graph

The data_wordpressapi_raw function gets data from the WordPress API and stores it as CSV objects in Amazon S3. The data_wordpressapi_bronze function transforms these objects to Parquet and stores them in a separate bucket. If either function fails, AWS SNS publishes an alert.

While this process works fine, the extracted data is not currently utilized. To derive value from this data, I need to consider transforming it. Several options are available, such as:

  • Creating new Lambda functions.
  • Importing the data into a database.
  • Third-party solutions like Databricks.

Here, I’ve chosen to use AWS Glue. As a fully managed ETL service, Glue automates various data processes in a low-code environment. I’ve not written much about it, so it’s time that changed!

Firstly, I’ll examine AWS Glue and some of its concepts. Next, I’ll create some Glue resources that interact with my WordPress S3 objects. Finally, I’ll integrate those resources into my existing Step Function workflow and examine their costs.

Let’s begin with some information about AWS Glue.

AWS Glue Concepts

This section explores AWS Glue and some of its data discovering features.

AWS Glue

From the AWS Glue User Guide:

AWS Glue is a serverless data integration service that makes it easy for analytics users to discover, prepare, move, and integrate data from multiple sources. You can use it for analytics, machine learning, and application development. It also includes additional productivity and data ops tooling for authoring, running jobs, and implementing business workflows.

https://docs.aws.amazon.com/glue/latest/dg/what-is-glue.html

Glue can be accessed using the AWS Glue console web interface and the AWS Glue Studio graphical interface. It can also be accessed programmatically via the AWS Glue CLI and the AWS Glue SDK.

Benefits of AWS Glue include:

  • Data-specific features like data cataloguing, schema discovery, and automatic ETL code generation.
  • Infrastructure optimised for ETL tasks and data processes.
  • Built-in scheduling capabilities and job execution.
  • Integration with other AWS services like Athena and Redshift.

AWS Glue’s features fall into Discover, Prepare, Integrate and Transform categories. The Glue features used in this post come from the data discovering category.

Glue Data Catalog

An AWS Glue Data Catalog is a managed repository serving as a central hub for storing metadata about data assets. It includes table and job definitions, and other control information for managing an AWS Glue environment. Each AWS account has a dedicated AWS Glue Data Catalog for each region.

The Data Catalog stores information as metadata tables, with each table representing a specific data store and its schema. Glue tables can serve as sources or targets in job definitions. Tables are organized into databases, which are logically grouped collections of related table definitions.

Each table contains column names, data type definitions, partition information, and other metadata about a base dataset. Data Catalog tables can be populated either manually or using Glue Crawlers.

Glue Crawler

A Glue Crawler connects to a data store, analyzes and determines its schema, and then creates metadata tables in the AWS Glue Data Catalog. They can run on-demand, be automated by services like Amazon EventBridge Scheduler and AWS Step Functions, and be started by AWS Glue Triggers.

Crawlers can crawl several data stores including:

  • Amazon S3 buckets via native client.
  • Amazon RDS databases via JDBC.
  • Amazon DocumentDB via MongoDB client.

An activated Glue Crawler performs the following processes on the chosen data store:

  • Firstly, data within the store is classified to determine its format, schema and properties.
  • Secondly, data is grouped into tables or partitions.
  • Finally, the Glue Data Catalog is updated. Glue creates, updates and deletes tables and partitions, and then writes the metadata to the Data Catalog accordingly.

Now let’s create a Glue Crawler!

Creating A Glue Crawler

In this section, I use the AWS Glue console to create and run a Glue Crawler for discovering my WordPress data.

Crawler Properties & Sources

There are four steps to creating a Glue Crawler. Step One involves setting the crawler’s properties. Each crawler needs a name and can have optional descriptions and tags. This crawler’s name is wordpress_bronze.

Step Two sets the crawler’s data sources, which is greatly influenced by whether the data is already mapped in Glue. If it is then the desired Glue Data Catalog tables must be selected. Since my WordPress data isn’t mapped yet, I need to add the data sources instead.

My Step Function workflow puts the data in S3, so I select S3 as my data source and supply the path of my bronze S3 bucket’s wordpress_api folder. The crawler will process all folders and files contained in this S3 path.

Finally, I need to configure the crawler’s behaviour for subsequent runs. I keep the default setting, which re-crawls all folders with each run. Other options include crawling only folders added since the last crawl or using S3 Events to control which folders to crawl.

Classifiers are also set here but are out of scope for this post.

Crawler Security & Targets

Step Three configures security settings. While most of these are optional, the crawler needs an IAM role to interact with other AWS services. This role consists of two IAM policies:

  • An AWSGlueServiceRole AWS managed policy which allows access to related services including EC2, S3, and Cloudwatch Logs.
  • A customer-managed policy with s3:GetObject and s3:PutObject actions allowed on the S3 path given in Step Two.

This role can be chosen from existing roles or created with the crawler.

Step Four begins with setting the crawler’s output. The Crawler creates new tables, requiring the selection of a target database for these tables. This database can be pre-existing or created with the crawler.

An optional table name prefix can also be set, which enables easy table identification. I create a wordpress_api database in the Glue Data Catalog, and set a bronze- prefix for the new tables.

The Crawler’s schedule is also set here. The default is On Demand, which I keep as my Step Function workflow will start this crawler. Besides this, there are choices for Hourly, Daily, Weekly, Monthly or Custom cron expressions.

Advanced options including how the crawler should handle detected schema changes and deleted objects in the data store are also available in Step Four, although I’m not using those here.

And with that, my crawler is ready to try out!

Running The Crawler

My crawler can be tested by accessing it in the Glue console and selecting Run Crawler:

2024 05 23 RunCrawler

The crawler’s properties include run history. Each row corresponds to a crawler execution, recording data including:

  • Start time, end time and duration.
  • Execution status.
  • DPU hours for billing.
  • Changes to tables and partitions.
2024 05 23 GlueCrawlerRuns

AWS stores the logs in an aws-glue/crawlers CloudWatch Log Group, in which each crawler has a dedicated log stream. Logs include messages like the crawler’s configuration settings at execution:

Crawler configured with Configuration 
{
    "Version": 1,
    "CreatePartitionIndex": true
}
 and SchemaChangePolicy 
{
    "UpdateBehavior": "UPDATE_IN_DATABASE",
    "DeleteBehavior": "DEPRECATE_IN_DATABASE"
}

And details of what was changed and where:

Table bronze-statistics_pages in database wordpress_api has been updated with new schema

Checking The Data Catalog

So what impact has this had on the Data Catalog? Accessing it and selecting the wordpress_api database now shows five tables, each matching S3 objects created by the Step Functions workflow:

2024 05 23 GlueDataCatalogTables

Data can be viewed by selecting Table Data on the desired row. This action executes an Athena query, triggering a message about the cost implications:

You will be taken to Athena to preview data, and you will be charged separately for Athena queries.

If accepted, Athena generates and executes a SQL query in a new tab. In this example, the first ten rows have been selected from the wordpress_api database’s bronze-posts table:

SQL
SELECT * 
FROM "AwsDataCatalog"."wordpress_api"."bronze-posts" 
LIMIT 10;

When this query is executed, Athena checks the Glue Data Catalog for the bronze-posts table in the wordpress_api database. The Data Catalog provides the S3 location for the data, which Athena reads and displays successfully:

2024 05 23 AthenaBronzeQueryResults

Now that the crawler works, I’ll integrate it into my Step Function workflow.

Crawler Integration & Costs

In this section, I integrate my Glue Crawler into my existing Step Function workflow and examine its costs.

Architectural Diagrams

Let’s start with some diagrams. This is how the crawler will behave:

While updating the crawler’s wordpress_bronze CloudWatch Log Stream throughout:

  1. The wordpress_bronze Glue Crawler crawls the bronze S3 bucket’s wordpress-api folder.
  2. The crawler updates the Glue Data Catalog’s wordpress-api database.

This is how the Crawler will fit into my existing Step Functions workflow:

wordpress api stepfunction rawbronze

While updating the workflow’s CloudWatch Log Group throughout:

  1. An EventBridge Schedule executes the Step Functions workflow.
  2. Raw Lambda function is invoked.
    • Invocation Fails: Publish SNS message. Workflow ends.
    • Invocation Succeeds: Invoke Bronze Lambda function.
  3. Bronze Lambda function is invoked.
    • Invocation Fails: Publish SNS message. Workflow ends.
    • Invocation Succeeds: Run Glue Crawler.
  4. Glue Crawler runs.
    • Run Fails: Publish SNS message. Workflow ends.
    • Run Succeeds: Update Glue Data Catalog. Workflow ends.

An SNS message is published if the Step Functions workflow fails.

Step Function Integration

Time to build! Let’s begin with the crawler’s requirements:

  • The crawler must only run after both Lambda functions.
  • It must also only run if both functions invoke successfully first.
  • If the crawler fails it must alert via the existing PublishFailure SNS topic.

This requires adding an AWS Glue: StartCrawler action to the workflow after the second AWS Lambda: Invoke action:

2024 05 23 StepFunctionStartCrawler

This action differs from the ones I’ve used so far. The existing actions all use optimized integrations that provide special Step Functions workflow functionality.

Conversely, StartCrawler uses an SDK service integration. These integrations behave like a standard AWS SDK API call, enabling more fine-grained control and flexibility than optimised integrations at the cost of needing more configuration and management.

Here, the Step Functions StartCrawler action calls the Glue API StartCrawler action. After adding it to my workflow, I update the action’s API parameters with the desired crawler’s name:

JSON
{
  "Name": "wordpress_bronze"
}

Next, I update the action’s error handling to catch all errors and pass them to the PublishFailure task. These actions produce these additions to the workflow’s ASL code:

JSON
  "Start Bronze Crawler": {
      "Type": "Task",
      "End": true,
      "Parameters": {
        "Name": "wordpress_bronze"
      },
      "Resource": "arn:aws:states:::aws-sdk:glue:startCrawler",
      "Catch": [
        {
          "ErrorEquals": [
            "States.ALL"
          ],
          "Next": "PublishFailure"
        }
      ]
    },

And result in an updated workflow graph:

stepfunctions graph gluecrawler

Additionally, the fully updated Step Functions workflow ASL script can be viewed on my GitHub.

Finally, I need to update the Step Function workflow IAM role’s policy so that it can start the crawler. This involves allowing the glue:StartCrawler action on the crawler’s ARN:

JSON
{
    "Version": "2012-10-17",
    "Statement": [
        {
            "Sid": "AllowBronzeGlueCrawler",
            "Effect": "Allow",
            "Action": [
                "glue:StartCrawler"
            ],
            "Resource": [
                "arn:aws:glue:eu-west-1:[REDACTED]:crawler/wordpress_bronze"
            ]
        }

My Step Functions workflow is now orchestrating the Glue Crawler, which will only run once both Lambda functions are successfully invoked. If either function fails, the SNS topic is published and the crawler does not run. If the crawler fails, the SNS topic is published. Otherwise, if everything runs successfully, the crawler updates the Data Catalog as needed.

So how much does discovering data with AWS Glue cost?

Glue Costs

This is from AWS Glue’s pricing page for crawlers:

There is an hourly rate for AWS Glue crawler runtime to discover data and populate the AWS Glue Data Catalog. You are charged an hourly rate based on the number of Data Processing Units (or DPUs) used to run your crawler. A single DPU provides 4 vCPU and 16 GB of memory. You are billed in increments of 1 second, rounded up to the nearest second, with a 10-minute minimum duration for each crawl.

$0.44 per DPU-Hour, billed per second, with a 10-minute minimum per crawler run

https://aws.amazon.com/glue/pricing/

And for the Data Catalog:

With the AWS Glue Data Catalog, you can store up to a million objects for free. If you store more than a million objects, you will be charged $1.00 per 100,000 objects over a million, per month. An object in the Data Catalog is a table, table version, partition, partition indexes, statistics or database.

The first million access requests to the Data Catalog per month are free. If you exceed a million requests in a month, you will be charged $1.00 per million requests over the first million. Some of the common requests are CreateTable, CreatePartition, GetTable , GetPartitions, and GetColumnStatisticsForTable.

https://aws.amazon.com/glue/pricing/

So how does this relate to my workflow? The below Cost Explorer chart shows my AWS Glue API costs from 01 May to 28 May. Only the CrawlerRun API operation has generated charges, with a daily average of $0.02:

2024 05 28 GlueAPICostMay28

My May 2024 AWS bill shows further details on the requests and storage items. The Glue Data Catalog’s free tier covers my usage:

2024 05 28 GlueCostsMay28

Finally, let’s review the entire pipeline’s costs for April and May. Besides Glue, my only other cost remains S3:

2024 05 28 CostExplorerAprMay

Summary

In this post, I used the data discovering features of AWS Glue to crawl and catalogue my WordPress API pipeline data.

Glue’s native features and integration with other AWS services make it a great fit for my WordPress pipeline’s pending processes. I’ll be using additional Glue features in future posts, and wanted to spotlight the Data Catalog early on as it’ll become increasingly helpful as my use of AWS Glue increases.

If this post has been useful then the button below has links for contact, socials, projects and sessions:

SharkLinkButton 1

Thanks for reading ~~^~~

Categories
Training & Community

Shark’s Summit Session

In this post, I discuss my recent Building And Automating Data Pipelines session presented at 2024’s AWS Summit London.

Table of Contents

Introduction

One of my YearCompass 2024 goals was to build a personal brand and focus on my soft skills and visibility. After participating in 2023’s New Stars Of Data 6 event, I wrote some new session abstracts and considered my next move. Then in February I saw Matheus Guimaraes‘ LinkedIn invite to submit sessions for 2024’s AWS Summit London event:

2024 04 09 LinkedInMatheus

I mulled it over, deciding to submit an abstract using my recent WordPress Data Pipeline project. At the very least, it’d be practice for both writing abstracts and pushing myself to submit them.

And that’s where I expected it to end. Until…

2024 04 09 GmailAccept

Just like that, I was heading to the capital again! And this time as a speaker!

My AWS Summit London (ASL) experience was going to be different from my New Stars Of Data (NSOD) one in several ways:

  • While NSOD was virtual, ASL would be in person.
  • I had four months to prepare for NSOD, and five weeks for ASL.
  • My NSOD session was 60 minutes, while ASL would be 30.

So I dusted off my NSOD notes, put a plan together and got to work!

Preparation

This section examines the preparation of the slides and demo for my summit session.

Slides

Firstly, I brainstormed what the session should include from my recent posts. Next, I storyboarded what the session’s sections would be. These boiled down to:

  • Defining the problem. I wanted to use an existing framework for this, ultimately choosing the 4Vs Of Big Data. These have been around since the early 2000’s, and are equally valid today for EDA and IOT events, API requests, logging metrics and many other modern technologies.
  • Examining the AWS services comprising the data pipeline, and highlighting features of each service that relate to the 4Vs.
  • Demonstrating the AWS services in a real pipeline and showing further use cases.

This yielded a rough schedule for the session:

  • 00:00-05:00 Introduction
  • 05:00-10:00 Problem Definition
  • 10:00-15:00 Solution Architecture
  • 15:00-20:00 Demo
  • 20:00-25:00 Summary
  • 25:00-30:00 Questions

Creating and editing the slide deck was much simpler with this in place. Each slide now needed to conform with and add value to its section. It became easier to remove bloat and streamline the wordier slides.

Several slides then received visual elements. This made them more audience-friendly and gave me landmarks to orient myself within the deck. I used AWS architecture icons on the solution slides and sharks on the problem slides. Lots of sharks.

Here’s the finished deck. I regret nothing.

As I was rounding off the slides, the summit agenda was published with the Community Lounge sessions. It was real now!

2024 04 24 AWSSummitSession

Demo

I love demos and was keen to include one for my summit session.

Originally I wanted a live demo, but this needed a good internet connection. It was pointed out to me that an event with thousands of people might not have the best WiFi reception, leading to slow page loads at best and 404s at worst!

So I recorded a screen demo instead. From a technical standpoint, this protected the demo from platform outages, network failures and zero-day bugs. And from a delivery standpoint, a pre-recorded demo let me focus on communicating my message to the audience instead of potentially losing my place, mistyping words and overrunning the allocated demo time.

The demo used this workflow, executed by an EventBridge Schedule:

stepfunctions graph

The demo’s first versions involved building the workflow and schedule from scratch. This overran the time allocation and felt unfocused. Later versions began with a partly constructed workflow. This built on the slides and improved the demo’s flow. I was far happier with this version, which was ultimately the one I recorded.

I recorded the demo with OBS Studio – a free open-source video recording and live-streaming app. There’s a lot to OBS, and I found this GuideRealmVideos video helpful in setting up my recording environment:

Delivery

This section covers the rehearsal and delivery of my AWS summit session.

Rehearsal

With everything in place, it was time to practise!

I had less time to practise this compared to NSOD, so I used various strategies to maximise my time. I started by practising sections separately while refining my notes. This gave all sections equal attention and highlighted areas needing work.

Next, after my success with it last time, I did several full run-throughs using PowerPoint’s Speaker Coach. This went well and gave me confidence in the content and slide count.

2024 04 27 RehersalReportClip

The slide visuals worked so well that I could practise the opening ten minutes without the slides in front of me! This led to run-throughs while shopping, on public transport and even in the queue for the AWS Summit passes.

Probably got some weird looks for that. I still regret nothing.

Practising the demo was more challenging! While the slides were fine as long as I hit certain checkpoints, the demo’s pace was entirely pre-determined. I knew what the demo would do, but keeping in sync with my past self was tricky to master. I was fine as long as I could see my notes and the demo in real-time.

Finally, on the night before I did some last-minute practice runs with the hotel room’s TV:

PXL 20240423 1801344612

On The Day

My day started with being unable to find the ExCel’s entrance! Great. But still better than a 05:15 Manchester train! I got my event pass and hunted for the Community Lounge, only to find my name in lights!

PXL 20240424 1202226372

The lounge itself was well situated, away from potentially distracting stands and walkways but still feeling like an important part of the summit.

PXL 20240424 0850558352

I spent some time adjusting to the space and battling my brewing anxiety. Then Matheus and Rebekah Kulidzan appeared and gave me some great and much-appreciated advice and encouragement! Next, I went for a wander with my randomised feel-good playlist that threw out some welcome bangers:

I watched Yan’s session, paying attention to his delivery and mannerisms alongside his session’s content. After he finished I powered on, signed in and miked up. The lounge setup was professional but not intimidating, and the AWS staff were helpful and attentive. Finally, at noon I went live!

IMG 3907
Photo by Thembile Ndlovu

The session went great! I had a good audience, kept my momentum and hit my section timings. I had a demo issue when my attempt to duplicate displays failed. Disaster was averted by playing the demo on the main screens only!

Finally, my half-hour ended and I stepped off the stage to applause, questions and an unexpected hug!

Looking Back

So what’s next?

I was happy with the amount of practice I did, and will continue putting time into this in the coming months. I’ve submitted my summit session to other events, and the more rehearsals I complete the higher my overall standard should get.

I also want to find a more reliable way of showing demos without altering Windows display settings. Changing these settings mid-presentation isn’t the robust solution I thought it was, so I want to find a feature or setting that’ll take care of that.

Finally, I plan to act on advice from Laurie Kirk. She suggested speaking about a day’s events on camera and then watching it back the following day. This highlights development areas and will get me used to speaking under observation.

Summary

In this post, I discussed my recent Building And Automating Data Pipelines session presented at 2024’s AWS Summit London.

When writing my post about the 2022 AWS Summit London event, I could never have known I’d find myself on the lineup a few years later! Tech communities do great jobs of driving people forward, and while this is usually seen through a technical lens the same is true for personal skills.

The AWS Community took this apprehensive, socially anxious shark and gave him time, a platform and an audience. These were fantastic gifts that I’m hugely grateful for and will always remember.

PXL 20240424 1606465872

If this post has been useful then the button below has links for contact, socials, projects and sessions:

SharkLinkButton 1

Thanks for reading ~~^~~