AWS Organizations now supports the full IAM policy language in Service Control Policies (SCPs). In this post, learn how to use the new features safely along with some examples.
(Oh, and for those unclear on the niche image header. – Ed)
Table of Contents
Introduction
On 19 September 2025, AWS announced and posted that AWS Organizations now offers full IAM policy language support for service control policies (SCPs):
AWS Organizations now offers full IAM policy language support for service control policies (SCPs), enabling you to write SCPs with the same flexibility as IAM managed policies. With this launch, SCPs now support use of conditions, individual resource ARNs, and the
NotActionelement withAllowstatements. Additionally, you can now use wildcards at the beginning or middle ofActionelement strings and theNotResourceelement.
In this post, I’ll explain what this change means in practice, provide examples from my AWS accounts, and share patterns to help adopt the new features safely. Whether implementing organization-wide guardrails, securing sandbox accounts or preventing accidental outages, this guidance will show how to get the most from SCPs after this update.
Service Control Policies
This section examines SCPs in closer detail. What are they? What do they do? And what benefits do they offer?
What Are SCPs?
Service Control Policies (SCPs) are an AWS Organizations feature that apply permission guardrails across multiple AWS accounts. To use SCPs, the AWS Organization must have all features enabled.
SCPs do not grant permissions. Instead, they define the maximum available permissions that IAM users and roles in an account can receive. Any action not permitted by an SCP is implicitly denied, even if an IAM policy within the account allows it. SCP syntax is similar to that used by IAM permission policies and resource-based policies (such as S3 bucket policies).
SCPs can be attached to the root of an AWS Organization, to an Organizational Unit (OU), or to individual accounts.
What Do SCPs Do?
SCPs use IAM policies and resource policies to determine whether to permit an action. The evaluation process consists of three parts:
Hierarchy & Inheritance
SCPs flow down through an AWS Organization. Attach a policy at the root, and everything underneath, including both OUs and accounts, inherits it. Each account ends up with the combined effect of every SCP above it.
Testing policies in a non-production OU before using them more widely helps to prevent unexpected lockouts!
Interaction with IAM and Resource Policies
SCPs define the boundaries within which IAM and resource policies operate. If either an SCP or IAM policy denies the action, then the request will be rejected. SCPs apply to all IAM users in an account, including the root user. Service-linked roles are usually exempt, allowing AWS services to function properly.
AWS have great documentation regarding how SCPs and IAM are evaluated.
Allow and Deny Approaches
By default, each account inherits the AWS-managed FullAWSAccess SCP that imposes no restrictions. Administrators can then apply additional policies using one of two strategies:
- Deny list: Retain
FullAWSAccessand add explicit Deny statements for disallowed services or actions. - Allow list: Remove
FullAWSAccessand explicitly allow only the required services and actions. Everything else is implicitly denied.
In both models, explicit Deny statements always take priority.
Benefits Of SCPs
SCPs provide several advantages for organizations operating at scale or under compliance requirements:
- Centralised Governance: Policies can be applied uniformly across all accounts from a single, central location. This reduces configuration drift and ensures consistent governance.
- Enforcing Least Privilege: SCPs support least privilege by limiting available services and actions to only those that are approved. Additionally, newly launched AWS services can be blocked until they are approved.
- Compliance & Risk Management: SCPs can implement controls like restricting access, requiring encryption or preventing the deletion of critical resources. These measures help reduce the risks associated with accidental misconfigurations and malicious actions.
- Scalability & Efficiency: Managing IAM policies across multiple accounts is inefficient. SCPs streamline management by allowing the implementation of guardrails at both the OU and root levels.
- Autonomy With Boundaries: SCPs create a secure outer boundary, allowing account teams to manage IAM policies within that boundary. This approach strikes a balance between enabling self-service and maintaining organizational controls.
Useful SCP & IAM Sites
This section has sites that I frequently hunt for when researching or writing SCPs for my AWS Organizations. This can be a struggle, as I usually forget what they’re called or what to search for! So for all the times I’ve remembered that these sites exist but couldn’t find them, they are here. This one’s for you Future Damo.
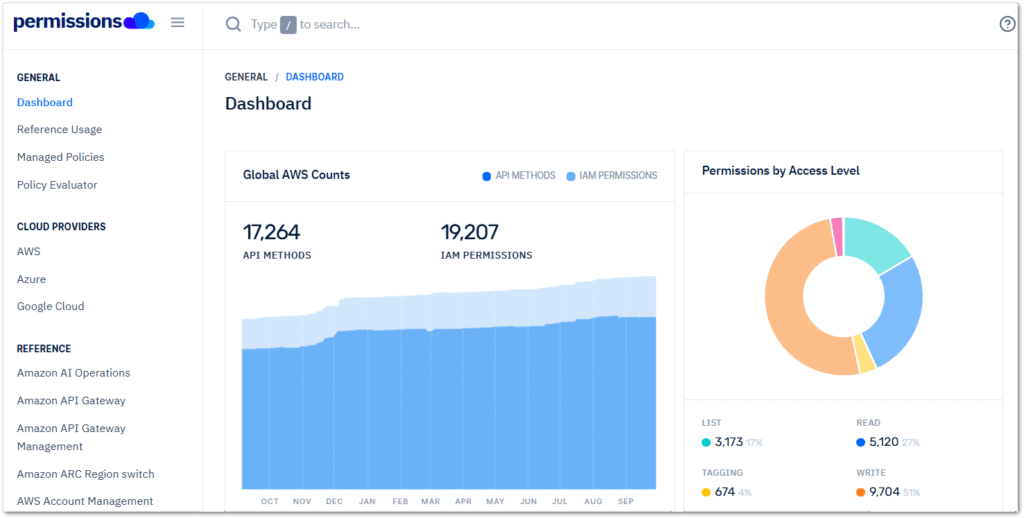
aws.permissions.cloud
aws.permissions.cloud compiles and organises a comprehensive collection of AWS IAM actions, managed policies, and permission metadata. This is presented in a searchable and structured format that includes tables and visualisations. The website uses the IAM Dataset created by AWS Community Hero Ian Mckay. Users can navigate the site using the left sidebar or by searching for a specific managed policy, IAM permission, or API method using the search bar at the top.
When comparing permissions.cloud‘s S3 Permissions Reference to the AWS S3 Service Authorization Reference, the two have many similarities. However, permissions.cloud features a better layout and includes a Used By column that indicates which AWS APIs use that IAM action.
In some cases this may be obvious, like the S3.AbortMultipartUpload API call using the s3:AbortMultipartUpload IAM action. Where this shines is with less obvious cases, like the FSx.CreateAndAttachS3AccessPoint API‘s use of the s3:CreateAccessPoint IAM action. While this information is all available in the documentation, having it all together in a searchable table is highly convenient.
asecure.cloud
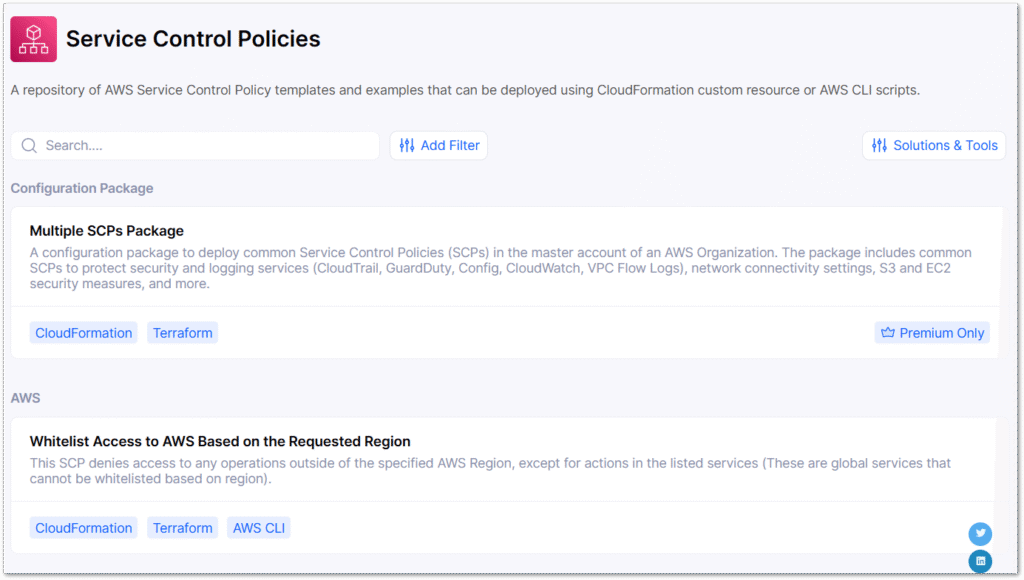
asecure.cloud is a cloud security and compliance platform that aggregates AWS-recommended security configurations, automates environment assessments and enables rapid infrastructure-as-code remedial deployment.
The platform includes a library of security controls for numerous AWS services, IAM policies, cost controls and a configuration builder. While some content is premium-only, the free resources are substantial. Examples can be deployed using CloudFormation (and Terraform in many cases) custom templates, as well as AWS CLI scripts. For example, this page has a repository for Service Control Policy templates in several formats.
Speaking of which…
SCPs I Use
This section has some SCPs I use in my previously discussed AWS Organization. Each SCP has a policy and a brief description of what it does.
Deny LeaveOrganization
This policy, included in the AWS example SCPs, stops member account administrators from removing their accounts from an AWS Organization:
{
    "Version": "2012-10-17",
    "Statement": [
        {
            "Effect": "Deny",
            "Action": [
                "organizations:LeaveOrganization"
            ],
            "Resource": "*"
        }
    ]
}- Actions: Targets
organizations:LeaveOrganization. - Effect:
Deny– Blocks the specified action - Condition: None – applies unconditionally to all accounts
- Result: The account cannot leave an AWS Organization.
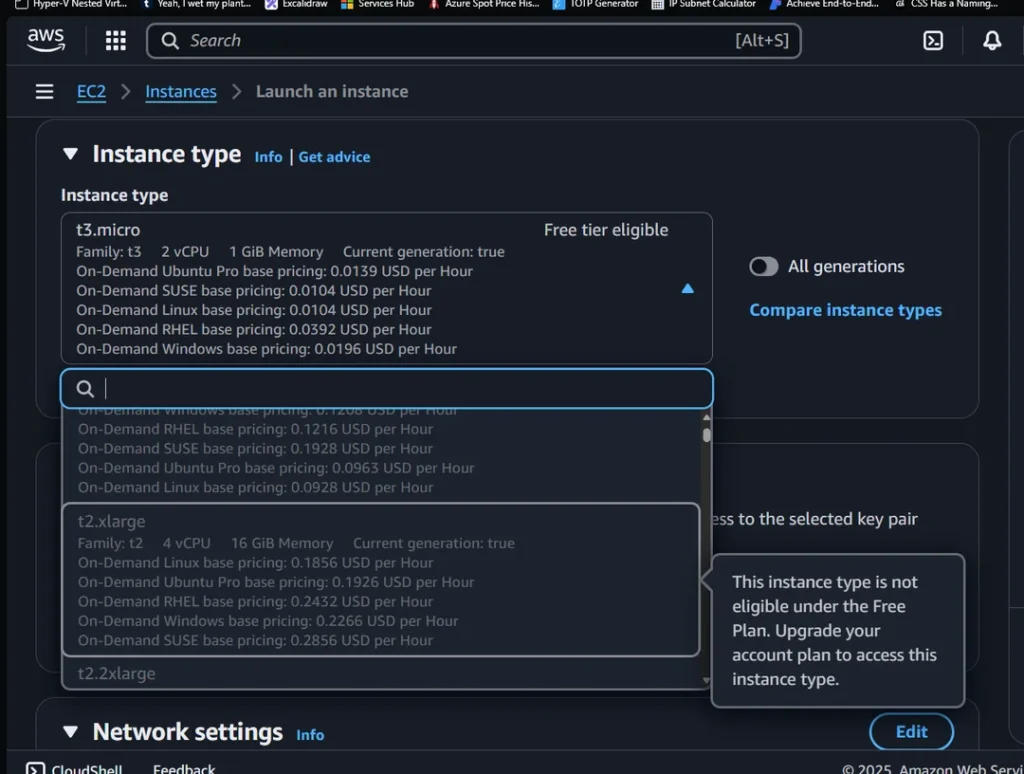
Restrict EC2 Instance Type
This asecurecloud policy prevents the launch of any EC2 instance type that isn’t allowed. I’m no big user of EC2, so this is currently set to t3.micro:
{
    "Version": "2012-10-17",
    "Statement": [
        {
            "Action": [
                "ec2:RunInstances"
            ],
            "Resource": "*",
            "Effect": "Deny",
            "Condition": {
                "StringNotEquals": {
                    "ec2:InstanceType": "t3.micro"
                }
            }
        }
    ]
}- Action: Targets
ec2:RunInstances - Effect:
Deny– blocks the action when conditions are met - Condition:
StringNotEqualswithec2:InstanceType: "t3.micro" - Result: Denies launching any EC2 instance that is NOT a t3.micro
Restrict Lambda Python Runtime
This policy prevents the deployment of Lambda functions using the specified runtimes. This ensures that an account’s Lambda functions are consistent:
{
  "Version": "2012-10-17",
  "Statement": [
    {
      "Sid": "DenyUnsupportedLambdaRuntimes",
      "Effect": "Deny",
      "Action": [
        "lambda:CreateFunction",
        "lambda:UpdateFunctionConfiguration"
      ],
      "Resource": "*",
      "Condition": {
        "ForAllValues:StringEquals": {
          "lambda:Runtime": [
            "python3.11",
            "python3.10",
            "python3.9"
          ]
        }
      }
    }
  ]
}
How it works:
- Actions: Targets both
lambda:CreateFunctionandlambda:UpdateFunctionConfiguration - Effect:
Deny– blocks actions when conditions are met. - Condition:
ForAllValues:StringEqualswith denied runtimes. - Result: Users can’t create or update Lambda functions using Python 3.9, 3.10, or 3.11.
Restrict AWS Service Use
This policy restricts AWS service usage to only specified services in approved regions.
{
  "Version": "2012-10-17",
  "Statement": [
    {
      "Sid": "AllowServicesBasedOnRegion",
      "Effect": "Allow",
      "Action": [
        "ec2:*",
        "s3:*",
        "states:*",
        "lambda:*",
        "cloudformation:*",
        "iam:*",
        "cloudwatch:*"
      ],
      "Resource": "*",
      "Condition": {
        "StringEquals": {
          "aws:RequestedRegion": [
            "AWS-REGION-1",
            "AWS-REGION-2"
          ]
        }
      }
    }
  ]
}Actions:
ec2:*– All EC2 operationss3:*– All S3 operationsstates:*– All Step Functions operationslambda:*– All Lambda operationscloudformation:*– All CloudFormation operationsiam:*– All IAM operationscloudwatch:*– All CloudWatch operations
- Effect:
Allow– Permits the specified actions when conditions are met. - Conditions:
StringEqualswithaws:RequestedRegionmatching “AWS-REGION-1” or “AWS-REGION-2”
Result:
- Only the seven specified service categories are allowed.
- These services only work in the two specified regions.
- All other AWS services are implicitly denied.
- All other regions are blocked for any service.
Summary
In this post, we learned how to use the new AWS Organizations SCP features safely along with some examples.
Full support for IAM policy language in SCPs greatly enhances the governance capabilities of AWS Organizations. This allows for resource-level constraints, conditional logic and advanced action matching. To implement these features effectively, follow clear change control processes:
- Validate policies in isolated OUs
- Run representative simulations.
- Stage deployments.
- Ensure that centralised documentation and incident recovery plans are established.
Like this post? Click the button below for links to contact, socials, projects and sessions:

Thanks for reading ~~^~~