Categories
Developing & Application Integration

Production Code Qualities

In this post, I respond to November 2022’s T-SQL Tuesday #156 Invitation and give my thoughts on some production code qualities.

tsql tuesday

Table of Contents

Introduction

This month, Tomáš Zíka’s T-SQL Tuesday invitation was as follows:

Which quality makes code production grade?

Please be as specific as possible with your examples and include your reasoning.

Good question!

In each section, I’ll use a different language. Firstly I’ll create a script, and then show a problem the script could encounter in production. Finally, I’ll show how a different approach can prevent that problem from occurring.

I’m limiting myself to three production code qualities to keep the post at a reasonable length, and so I can show some good examples.

Precision

In this section, I use T-SQL to show how precise code in production can save a data pipeline from unintended failure.

Setting The Scene

Consider the following SQL table:

USE [amazonwebshark]
GO

CREATE TABLE [2022].[sharkspecies](
	[shark_id] [int] IDENTITY(1,1) NOT NULL,
	[name_english] [varchar](100) NOT NULL,
	[name_scientific] [varchar](100) NOT NULL,
	[length_max_cm] [int] NULL,
	[url_source] [varchar](1000) NULL
)
GO

This table contains a list of sharks, courtesy of the Shark Foundation.

Now, let’s say that I have a data pipeline that uses data in amazonwebshark.2022.sharkspecies for transformations further down the pipeline.

No problem – I create a #tempsharks temp table and insert everything from amazonwebshark.2022.sharkspecies using SELECT *:

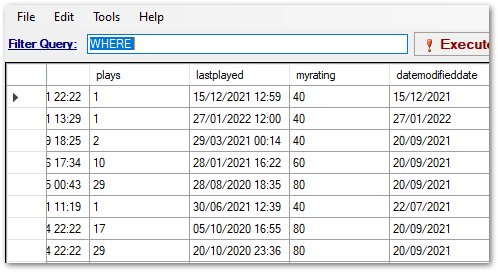
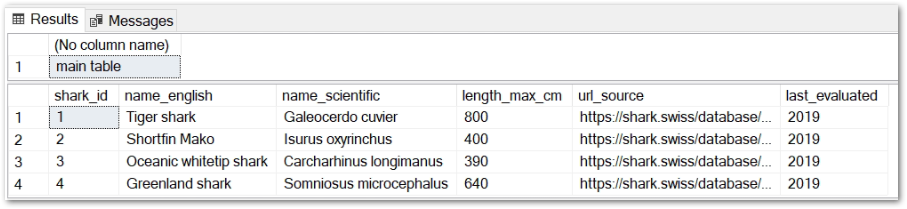
When this script runs in production, I get two tables with the same data:

2022 11 02 SQLResults1

What’s The Problem?

One day a new last_evaluated column is needed in the amazonwebshark.2022.sharkspecies table. I add the new column and backfill it with 2019:

ALTER TABLE [2022].sharkspecies
ADD last_evaluated INT DEFAULT 2019 WITH VALUES
GO

However, my script now fails when trying to insert data into #tempsharks:

2022 11 02 SQLResults2Sharp
(1 row affected)

(4 rows affected)

Msg 213, Level 16, State 1, Line 17
Column name or number of supplied values does not match table definition.

Completion time: 2022-11-02T18:00:43.5997476+00:00

#tempsharks has five columns but amazonwebshark.2022.sharkspecies now has six. My script is now trying to insert all six sharkspecies columns into the temp table, causing the msg 213 error.

Doing Things Differently

The solution here is to replace row 21’s SELECT * with the precise columns to insert from amazonwebshark.2022.sharkspecies:

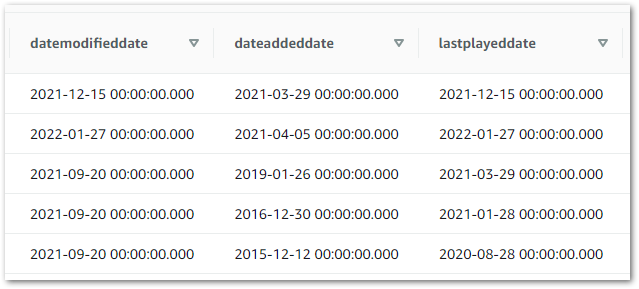
While amazonwebshark.2022.sharkspecies now has six columns, my script is only inserting five of them into the temp table:

2022 11 02 SQLResults3Sharp

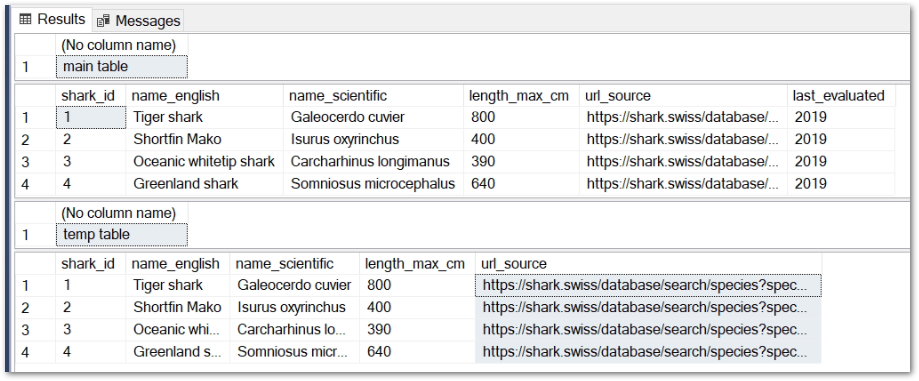
I can add the last_evaluated column into #tempsharks in future, but its absence in the temp table isn’t causing any immediate problems.

Works The Same In Other Environments

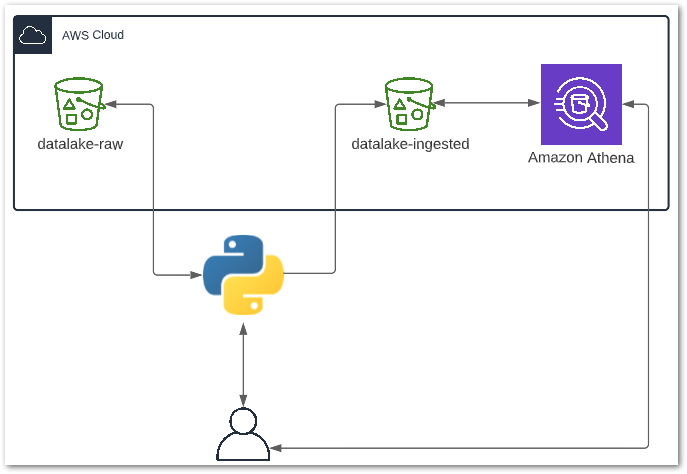
In this section, I use Python to show the value of production code that works the same in non-production.

Setting The Scene

Here I have a Python script that reads data from an Amazon S3 bucket using a boto3 session. I pass my AWS_ACCESSKEY and AWS_SECRET credentials in from a secrets manager, and create an s3bucket variable for the S3 bucket path:

When I deploy this script to my dev environment it works fine.

What’s The Problem?

When I deploy this script to production, s3bucket will still be s3://dev-bucket. The potential impact of this depends on the AWS environment setup:

Different AWS account for each environment:

  • dev-bucket doesn’t exist in Production. The script fails.

Same AWS account for all environments:

  • Production IAM roles might not have any permissions for dev-bucket. The script fails.
  • Production processes might start using a dev resource. The script succeeds but now data has unintentionally crossed environment boundaries.

Doing Things Differently

A solution here is to dynamically set the s3bucket variable based on the ID of the AWS account the script is running in.

I can get the AccountID using AWS STS. I’m already using boto3, so can use it to initiate an STS client with my AWS credentials.

STS then has a GetCallerIdentity action that returns the AWS AccountID linked to the AWS credentials. I capture this AccountID in an account_id variable, then use that to set s3bucket‘s value:

More details about get_caller_identity can be found in the AWS Boto3 documentation.

For bonus points, I can terminate the script if the AWS AccountID isn’t defined. This prevents undesirable states if the script is run in an unexpected account.

Speaking of which…

Prevents Undesirable States

In this section, I use PowerShell to demonstrate how to stop production code from doing unintended things.

Setting The Scene

In June I started writing a PowerShell script to upload lossless music files from my laptop to one of my S3 buckets.

I worked on it in stages. This made it easier to script and test the features I wanted. By the end of Version 1, I had a script that dot-sourced its variables and wrote everything in my local folder $ExternalLocalSource to my S3 bucket $ExternalS3BucketName:

#Load Variables Via Dot Sourcing
. .\EDMTracksLosslessS3Upload-Variables.ps1


#Upload File To S3
Write-S3Object -BucketName $ExternalS3BucketName -Folder $ExternalLocalSource -KeyPrefix $ExternalS3KeyPrefix -StorageClass $ExternalS3StorageClass

What’s The Problem?

NOTE: There were several problems with Version 1, all of which were fixed in Version 2. In the interests of simplicity, I’ll focus on a single one here.

In this script, Write-S3Object will upload everything in the local folder $ExternalLocalSource to the S3 bucket $ExternalS3BucketName.

Problem is, the $ExternalS3BucketName S3 bucket isn’t for everything! It should only contain lossless music files!

At best, Write-S3Object will upload everything in the local folder to S3 whether it’s music or not.

At worst, if the script is pointing at a different folder it will start uploading everything there instead! PowerShell commonly defaults to C:\Windows, so this could cause all kinds of problems.

Doing Things Differently

I decided to limit the extensions that the PowerShell script could upload.

Firstly, the script captures the extensions for each file in the local folder $ExternalLocalSource using Get-ChildItem and [System.IO.Path]::GetExtension:

$LocalSourceObjectFileExtensions = Get-ChildItem -Path $ExternalLocalSource | ForEach-Object -Process { [System.IO.Path]::GetExtension($_) }

Then it checks each extension using a ForEach loop. If an extension isn’t in the list, PowerShell reports this and terminates the script:

ForEach ($LocalSourceObjectFileExtension In $LocalSourceObjectFileExtensions) 

{
If ($LocalSourceObjectFileExtension -NotIn ".flac", ".wav", ".aif", ".aiff") 
{
Write-Output "Unacceptable $LocalSourceObjectFileExtension file found.  Exiting."
Start-Sleep -Seconds 10
Exit
}

So now, if I attempt to upload an unacceptable .log file, PowerShell raises an exception and terminates the script:

**********************
Transcript started, output file is C:\Files\EDMTracksLosslessS3Upload.log

Checking extensions are valid for each local file.
Unacceptable .log file found.  Exiting.
**********************

While an acceptable .flac file will produce this message:

**********************
Transcript started, output file is C:\Files\EDMTracksLosslessS3Upload.log

Checking extensions are valid for each local file.
Acceptable .flac file.
**********************

To see the code in full, as well as the other problems I solved, please check out my post from June.

Summary

In this post, I responded to November 2022’s T-SQL Tuesday #156 Invitation and gave my thoughts on some production code qualities. I gave examples of each quality and showed how they could save time and prevent unintended problems in a production environment.

Thanks to Tomáš for this month’s topic! My previous T-SQL Tuesday posts are here.

If this post has been useful, please feel free to follow me on the following platforms for future updates:

Thanks for reading ~~^~~

Categories
Data & Analytics

Ingesting iTunes Data Into AWS With Python And Athena

In this post, I will update my existing iTunes Python ETL to return a Parquet file, which I will then upload to S3 and view using Athena.

Table of Contents

Introduction

In my last post, I made an ETL that exported data from a CSV into a Pandas DataFrame using AWS Data Wrangler. That post ended with the transformed data being saved locally as a new CSV.

It’s time to do something with that data! I want to analyse my iTunes data and look for trends and insights into my listening habits. I also want to access these insights in the cloud, as my laptop is a bit bulky and quite slow. Finally, I’d prefer to keep my costs to a minimum.

Here, I’ll show how AWS and Python can be used together to meet these requirements. Let’s start with AWS.

Amazon S3

In this section, I will update my S3 setup. I’ll create some new buckets and explain my approach.

New S3 Buckets

Currently, I have a single S3 bucket containing my iTunes Export CSV. Moving forward, this bucket will contain all of my unmodified source objects, otherwise known as raw data.

To partner the raw objects bucket, I now have an ingested objects bucket. This bucket will contain objects where the data has been transformed in some way. My analytics tools and Athena tables will point here for their data.

Speaking of Athena, the other new bucket will be used for Athena’s query results. Although Athena is serverless, it still needs a place to record queries and store results. Creating this bucket now will save time later on.

Having separate buckets for each of these functions isn’t a requirement, although it is something I prefer to do. Before moving on, I’d like to run through some of the benefits I find with this approach.

Advantages Of Multiple Buckets

Firstly, having buckets with clearly defined purposes makes navigation way easier. I always know where to find objects, and rarely lose track of or misplace them.

Secondly, having multiple buckets usually makes my S3 paths shorter. This doesn’t sound like much of a benefit upfront, but the S3 path textboxes in the AWS console are quite small, and using long S3 paths in the command line can be a pain.

Finally, I find security and access controls are far simpler to implement with a multi-bucket setup. Personally I prefer “You can’t come into this house/bucket” over “You can come into this house/bucket, but you can’t go into this room/prefix”. However, both S3 buckets and S3 prefixes can be used as IAM policy resources so there’s technically no difference.

That concludes the S3 section. Next, let’s set up Athena.

Amazon Athena

In this section, I’ll get Athena ready for use. I’ll show the process I followed and explain my key decisions. Let’s start with my reasons for choosing Athena.

Why Athena?

Plenty has been written about Athena’s benefits over the years. So instead of retreading old ground, I’ll discuss what makes Athena a good choice for this particular use case.

Firstly, Athena is cheap. The serverless nature of Athena means I only pay for what I query, scan and store, and I’ve yet to see a charge for Athena in the three years I’ve been an AWS customer.

Secondly, like S3, Athena’s security is managed by IAM. I can use IAM policies to control who and what can access my Athena data, and can monitor that access in CloudTrail. This also means I can manage access to Athena independently of S3.

Finally, Athena is highly available. Authorised calls to the service have a 99.9% Monthly Uptime Percentage SLA and Athena benefits from S3’s availability and durability. This allows 24/7 access to Athena data for users and applications.

Setting Up Athena

To start this section, I recommend reading the AWS Athena Getting Started documentation for a great Athena introduction. I’ll cover some basics here, but I can’t improve on the AWS documentation.

Athena needs three things to get off the ground:

  • An S3 path for Athena query results.
  • A database for Athena tables.
  • A table for interacting with S3 data objects.

I’ve already talked about the S3 path, so let’s move on to the database. A database in Athena is a logical grouping for the tables created in it. Here, I create a blog_amazonwebshark database using the following script:

CREATE DATABASE blog_amazonwebshark

Next, I enter the column names from my iTunes Export CSV into Athena’s Create Table form, along with appropriate data types for each column. In response, the form creates this Athena table:

The form adds several table properties to the table’s DDL. These, along with the data types, are expanded on in the Athena Create Table documentation.

Please note that I have removed the S3 path from the LOCATION property to protect my data. The actual Athena table is pointing at an S3 prefix in my ingested objects bucket that will receive my transformed iTunes data.

Speaking of data, the form offers several choices of source data format including CSV, JSON and Parquet. I chose Parquet, but why do this when I’m already getting a CSV? Why create extra work?

Let me explain.

About Parquet

Apache Parquet is a file format that supports fast processing for complex data. It can essentially be seen as the next generation of CSV. Both formats have their place, but at scale CSV files have large file sizes and slow performance.

In contrast, Parquet files have built-in compression and indexing for rapid data location and retrieval. In addition, the data in Parquet files is organized by column, resulting in smaller sizes and faster queries.

This also results in Athena cost savings as Athena only needs to read the columns relevant to the queries being run. If the same data was in a CSV, Athena would have to read the entire CSV whether the data is needed or not.

For further reading, Databricks have a great Parquet section in their glossary.

That’s everything for Athena. Now I need to update my Python scripts.

Python

In this section, I’ll make changes to my Basic iTunes ETL to include my new S3 and Athena resources and to replace the CSV output with a Parquet file. Let’s start with some variables.

New Python Variables

My first update is a change to ETL_ITU_Play_Variables.py, which contains my global variables. Originally there were two S3 global variables – S3_BUCKET containing the bucket name and S3_PREFIX containing the S3 prefix path leading to the raw data:

S3_BUCKET
S3_PREFIX

Now I have two buckets and two prefixes, so it makes sense to update the variable names. I now have two additional global variables, adding _RAW to the originals and _INGESTED to the new ones for clarity:

S3_BUCKET_RAW
S3_PREFIX_RAW

S3_BUCKET_INGESTED
S3_PREFIX_INGESTED

Changing CSV To Parquet

The next change is to ETL_ITU_Play.py. The initial version converts a Pandas DataFrame to CSV using pandas.DataFrame.to_csv. I’m now replacing this with awswrangler.s3.to_parquet, which needs three parameters:

Put together, it looks like this:

wr.s3.to_parquet(
    df = df,
    boto3_session = session,
    path = s3_path_ingested

Before committing my changes, I took the time to put the main workings of my ETL in a class. This provides a clean structure for my Python script and will make it easier to reuse in future projects.

That completes the changes. Let’s review what has been created.

Architecture

Here is an architectural diagram of how everything fits together:

Here is a breakdown of the processes involved:

  1. User runs the Python ETL script locally.
  2. Python reads the CSV object in datalake-raw S3 bucket.
  3. Python extracts data from CSV into a DataFrame and transforms several columns.
  4. Python writes the DataFrame to datalake-ingested S3 bucket as a Parquet file.
  5. Python notifies User of a successful run.
  6. User sends query to Athena.
  7. Athena reads data from datalake-ingested S3 bucket.
  8. Athena returns query results to User.

Testing

In this section, I will test my resources to make sure they work as expected. Bare in mind that this setup hasn’t been designed with production use in mind, so my testing is somewhat limited and would be insufficient for production deployment.

Testing Python

TEST: Upload a CSV to the datalake-raw S3 bucket, then run the Python script. The Python script must run successfully and print updates in the terminal throughout.

RESULT: I upload an iTunes Export CSV to the datalake-raw S3 bucket:

The Python script runs, printing the following output in the terminal:

Creating DataFrame.
DataFrame columns are Index(['Name', 'Artist', 'Album', 'Genre', 'Time', 'Track Number', 'Year', 'Date Modified', 'Date Added', 'Bit Rate', 'Plays', 'Last Played', 'Skips', 'Last Skipped', 'My Rating', 'Location'], dtype='object')
Deleting unnecessary DataFrame columns.
Renaming DataFrame columns.
Reformatting DateTime DataFrame columns.
Creating Date Columns From DateTime Columns.
Creating MyRatingDigit Column.
Replacing blank values to prevent IntCastingNaN errors.
Setting Data Types.
Creating Parquet file from DataFrame.
Processes complete.

Testing S3

TEST: After the Python script successfully runs, the datalake-ingested S3 bucket must contain an itunesdata.parquet object.

RESULT: Upon accessing the datalake-ingested S3 bucket, an itunesdata.parquet object is found:

(On an unrelated note, look at the size difference between the Parquet and CSV files!)

Testing Athena

TEST: When the datalake-ingested S3 bucket contains an itunesdata.parquet object, data from the iTunes Export CSV must be shown when the following Athena query is run:

SELECT * FROM basic_itunes_python_etl;

RESULT: Most of the Athena results match the iTunes Export data. However, the transformed dates did not match expectations:

This appears to be a formatting problem, as some parts of a date format are still visible.

To diagnose the problem I wanted to see how these columns were being stored in the Parquet file. I used mukunku’s ParquetViewer for this, which is described in the GitHub repo as:

…a quick and dirty utility that I created to easily view Apache Parquet files on Windows desktop machines.

It works very well!

Here is a screenshot of the data. The lastplayed column has dates and times, while the datamodifieddate column has dates only:

The cause of the problem becomes apparent when the date columns are viewed using the ISO 8601 format:

The date columns are all using timestamps, even when no times are included!

A potential fix would be to change the section of my Python ETL script that handles data types. Instead, I update the data types used in my Athena table from date:

  `datemodifieddate` date, 
  `dateaddeddate` date, 
  `lastplayeddate` date, 

To timestamp:

  `datemodifieddate` timestamp, 
  `dateaddeddate` timestamp, 
  `lastplayeddate` timestamp, 

This time, when I view my Athena table the values all appear as expected:

Scripts

My ETL_ITU_Play.py file commit from 2022-08-08 can be viewed here:

ETL_ITU_Play.py on GitHub

My updated repo readme can be viewed here:

README.md on GitHub

Summary

In this post, I updated my existing iTunes Python ETL to return a Parquet file, which I then uploaded S3 and viewed using Athena. I explained my reasoning for choosing S3, Athena and the Parquet file format, and I handled a data formatting issue.

If this post has been useful, please feel free to follow me on the following platforms for future updates:

Thanks for reading ~~^~~

Categories
Security & Monitoring

Unexpected CloudWatch In The Billing Area

In this post I will investigate an unexpected CloudWatch charge on my April 2022 AWS bill, and explain how to interpret the bill and find the resources responsible.

Table of Contents

Introduction

My April 2022 AWS bill has arrived. The total wasn’t unusual – £4.16 is a pretty standard charge for me at the moment, most of which is S3. Then I took a closer look at the services and found an unexpected cost for CloudWatch, which is usually zero.

But not this month:

While $0.30 isn’t bank-breaking, it is unexpected and worth investigating. More importantly, nothing should be running in EU London! And there were no CloudWatch changes at all on my March 2022 bill. So what’s going on here?

Let’s start with the bill itself.

The April 2022 Bill

Looking at the bill, the rows with unexpected CloudWatch charges all mention alarms. Since nothing else has generated any charges, let’s take a closer look at all of the rows referring to alarms.

$0.00 Per Alarm Metric Month – First 10 Alarm Metrics – 10.000 Alarms

The AWS Always Free Tier includes ten CloudWatch alarms.

$0.10 Per Alarm Metric Month (Standard Resolution) – EU (Ireland) – 2.000002 Alarms

In EU Ireland, each standard resolution alarm after the first ten costs $0.10. The bill says there are twelve alarms in EU Ireland – ten of these are free and the other two cost $0.10 each – $0.20 in total.

$0.10 Per Alarm Metric Month (Standard Resolution) – EU (London) – 1.000001 Alarms

CloudWatch standard resolution alarms also cost $0.10 in EU London. As all my free alarms are seemingly in EU Ireland, the one in EU London costs a further $0.10.

So the bill is saying I have thirteen alarms – twelve in EU Ireland and one in EU London. Let’s open CloudWatch and see what’s going on there.

CloudWatch Alarm Dashboard

It seems I have thirteen CloudWatch alarms. Interesting, because I could only remember the four security alarms I set up in February.

CloudWatch says otherwise. This is my current EU Ireland CloudWatch dashboard:

Closer inspection finds eight alarms with names like:

  • TargetTracking-table/Rides-ProvisionedCapacityHigh-a53f2f67-9477-45a6-8197-788d2c7462b3
  • TargetTracking-table/Rides-ProvisionedCapacityLow-a36cf02f-7b3c-4fb0-844e-cf3d03fa80a9

Two of these are constantly In Alarm, and all have Last State Update values on 2022-03-17. The alarm names led me to suspect that DynamoDB was involved, and this was confirmed by viewing the Namespace and Metric Name values in the details of one of the alarms:

At this point I had an idea of what was going on. To be completely certain, I wanted to check my account history for 2022-03-17. That means a trip to CloudTrail!

CloudTrail Event History

CloudTrail’s Event History shows the last 90 days of management events. I entered a date range of 2022-03-17 00:00 > 2022-03-18 00:01 into the search filter, and it didn’t take long to start seeing some familiar-looking Resource Names:

Alongside the TargetTracking-table resource names linked to monitoring.amazonaws.com, there are also rows on the same day for other Event Sources including:

  • dynamodb.amazonaws.com
  • apigateway.amazonaws.com
  • lambda.amazonaws.com
  • cognito-idp.amazonaws.com

I now know with absolute certainty where the unexpected CloudWatch alarms came from. Let me explain.

Charge Explanations

So far I’ve reviewed my bills, found the CloudWatch alarms and established what was happening in my account when they were added. Now I’ll explain how this all led to charges on my bill.

The $0.20 EU Ireland Charge

When I was recently studying for the Developer Associate certification, I followed an AWS tutorial on how to Build a Serverless Web Application with AWS Lambda, Amazon API Gateway, AWS Amplify, Amazon DynamoDB, and Amazon Cognito. This was to top up my serverless knowledge before the exam.

The third module involves creating a DynamoDB table for the application. A table that I provisioned with auto-scaling for read and write capacity:

These auto-scaling policies rely on CloudWatch alarms to function, as demonstrated by some of the alarm conditions:

The DynamoDB auto-scaling created eight CloudWatch alarms. Four for Read Capacity Units:

  • ConsumedReadCapacityUnits > 42 for 2 datapoints within 2 minutes
  • ConsumedReadCapacityUnits < 30 for 15 datapoints within 15 minutes
  • ProvisionedReadCapacityUnits > 1 for 3 datapoints within 15 minutes
  • ProvisionedReadCapacityUnits < 1 for 3 datapoints within 15 minutes

And four for Write Capacity Units:

  • ConsumedWriteCapacityUnits > 42 for 2 datapoints within 2 minutes
  • ConsumedWriteCapacityUnits < 30 for 15 datapoints within 15 minutes
  • ProvisionedWriteCapacityUnits > 1 for 3 datapoints within 15 minutes
  • ProvisionedWriteCapacityUnits < 1 for 3 datapoints within 15 minutes

These eight alarms joined the existing four. The first ten were free, leaving two accruing charges.

This also explains why two alarms are always In Alarm – the criteria for scaling in are being met but the DynamoDB table can’t scale down any further.

I could have avoided this situation by destroying the resources after finishing the tutorial. The final module of the tutorial covers this. Instead I decided to keep everything around so I could take a proper look at everything under the hood.

No resources accrued any charges in March, so I left everything in place during April. I’ll go into why there was nothing on the March bill shortly, but first…

The $0.10 EU London Charge

Remember when I said that I shouldn’t be running anything in EU London? Turns out I was!

I found a very old CloudWatch alarm from 2020. It’s been there ever since. Never alerting so I didn’t know it was there. Included in the Always Free tier, so never costing me anything or triggering an AWS Budget alert. Appearing on my bill, but always as a free entry so never drawing attention.

When I exceeded my ten free CloudWatch alarms, the one in EU London became chargeable for the first time. A swift delete later and that particular problem is no more.

No CloudWatch Charge On The March 2022 Bill

That only leaves the question of why there were no CloudWatch charges on my March 2022 bill, despite there being thirteen alarms on my account for almost half of that month:

I wanted to understand what was going on, so I reached out to AWS Support.

In what must have been a first for them, I asked why no money had been billed for CloudWatch in March:

On my April 2022 bill I was charged $0.30 for CloudWatch. $0.20 in Ireland and $0.10 in London. I understand why.

What I want to understand is why I didn’t see a charge for them on my March 2022 bill. The alerts were added to the account on March 17th, so from that moment on I had thirteen alerts which is three over the free tier.

Can I get confirmation on why they don’t appear on March but do on April please?

I soon received a reply from AWS Support that explained the events in full:

…although you enabled all 13 Alarms in March, the system only calculated a pro-rated usage value, since the Alarms were only enabled on 17th March. The pro-rated Alarm usage values only amounted to 7.673 Alarms in the EU (Ireland) region, and 1.000003 Alarms in the EU (London) region.

The total pro-rated Alarm usage calculated for March (8.673003 Alarms) is thus within the 10 Alarm Free Tier threshold and thus incurred no charges, whereas in April the full 13 Alarm usage came into play for the entire month…

To summarise, I hadn’t been charged for the alarms in March because they’d only been on my account for almost half a month. Thanks for the help folks!

Summary

In this post I investigated an unexpected CloudWatch charge on my April 2022 AWS bill. I showed what the bill looked like, demonstrated how to find the resources generating the charges and explained how those resources came to be on my AWS account.

If this post has been useful, please feel free to follow me on the following platforms for future updates:

Thanks for reading ~~^~~