In this post, I set up the automation of my WordPress API data extraction Python script with AWS managed serverless services.
Table of Contents
- Introduction
- Architectural Decisions
- SNS & Parameter Store
- Python
- Lambda & CloudWatch
- EventBridge
- Costs
- Resources
- Summary
Introduction
In my previous post, I wrote a Python script for extracting WordPress API data. While it works fine, it relies on me logging in and pressing buttons. This isn’t convenient, and would be completely out of the question in a commercial use case. Wouldn’t it be great if something could run the script for me?
Enter some AWS managed serverless services that are very adept at automation! In this post, I’ll integrate these services into my existing architecture, test that everything works and see what my AWS costs are to date.
A gentle reminder: this is my first time setting up some of these services from scratch. This post doesn’t represent best practices, may be poorly optimised or include unexpected bugs, and may become obsolete. I expect to find better ways of doing these processes in the coming months and will link updates where appropriate.
Architectural Decisions
In this section, I examine my architectural decisions before starting work. Which AWS services will perform my WordPress data extraction automation? Note that these decisions are in addition to my previous ones.
AWS Lambda
Probably no surprises here. Whenever AWS and serverless come up, Lambda is usually the first service that comes to mind.
And with good reason! AWS Lambda deploys quickly and scales on demand. It supports several programming languages and practically every AWS service. It also has a generous free tier and requires no infrastructure management.
Lambda will provide my compute resources. This includes the runtime, execution environment and network connectivity for my Python script.
Amazon Cloudwatch
Amazon CloudWatch is a monitoring service that can collect and track performance data, generate insights and respond to resource state changes. It provides features such as metrics, alarms, and logs, letting users monitor and troubleshoot their applications and infrastructure in real time.
CloudWatch will record and store my Lambda function’s logs. I can see when my function is invoked, how long it takes to run and any errors that may occur.
So if something does go wrong, how will I know?
Amazon SNS
Amazon Simple Notification Service (SNS) is a messaging service that delivers notifications to a set of recipients or endpoints. It supports various messaging protocols like SMS, email and HTTP, making it helpful for building scalable and decoupled applications.
SNS will be the link between AWS and my email inbox. It will deliver messages from AWS about my Lambda function.
So that’s my alerting sorted. How does the function get invoked?
Amazon EventBridge
Amazon EventBridge is an event bus service that enables communication between different services using events. It offers a serverless and scalable platform with advanced event routing, integration capabilities and, crucially, scheduling and time expression functionality.
EventBridge is here to handle my automation requirements. Using a CRON expression, it’ll invoke my Lambda function regularly with no user input required.
Architectural Diagram
This is an architectural diagram of the AWS automation of my WordPress data extraction process:

- EventBridge invokes AWS Lambda function.
- AWS Lambda calls Parameter Store for WordPress, S3 and SNS parameters. Parameter Store returns these to AWS Lambda.
- Lambda Function calls WordPress API. WordPress API returns data.
- API data is written to S3 bucket.
If there’s a failure, the Lambda function publishes a message to an SNS topic. SNS then delivers this message to the user’s subscribed email address.
Meanwhile, Lambda is writing to a CloudWatch Log Group throughout its invocation.
SNS & Parameter Store
In this section, I configure Amazon SNS and update AWS Parameter Store to enable my WordPress data extraction automation alerting. This won’t take long!
SNS Configuration
SNS has two fundamental concepts:
- Topics: communication channels for publishing messages.
- Subscriptions: endpoints to send messages to.
Firstly, I create a new wordpress-api-raw standard SNS Topic. This topic doesn’t need encryption or delivery policies, so all the defaults are fine. An Amazon Resource Name (ARN) is assigned to the new SNS Topic, which I’ll put into Parameter Store.
Next, I create a new SNS Subscription for my SNS Topic that emails me when invoked.
There’s not much else to add here! That said, SNS can do far more than this. Check out SNS’s features and capabilities in the Developer Guide.
Parameter Store Configuration
Next, I need to add the new SNS Topic ARN to AWS Parameter Store.
I create a new string parameter, and assign the SNS Topic’s ARN as the value. That’s….it! With some changes, my Python script can now get the SNS parameter in the same way as the S3 and WordPress parameters.
Speaking of changing the Python script…
Python
In this section, I integrate SNS into my existing Python script and test the new outputs.
Function Updates
My script now has a new send_sns_message function:
It expects four arguments:
sns_client: the boto3 client used to contact AWS.topic_arn: the SNS topic to use for the message.subject: the message’s subject.message: the message to send.
Everything bar sns_client has string type hints. No return value is needed.
I create a try except block that attempts to send a message using the sns_client’s publish method and the supplied values. The log is updated with publish‘s success or failure.
Separately, I’ve also added a ParamValidationError exception to my get_parameter_from_ssm function. Previously the exceptions were:
    except ssm_client.exceptions.ParameterNotFound:
        logging.warning(f"Parameter {parameter_name} not found.")
        return ""

    except botocore.exceptions.ClientError as e:
        logging.error(f"Error getting parameter {parameter_name}: {e}")
        return ""
They are now:
    except ssm_client.exceptions.ParameterNotFound as pnf:
        logging.warning(f"Parameter {parameter_name} not found: {pnf}")
        return ""

    except botocore.exceptions.ParamValidationError as epv:
        logging.error(f"Error getting parameter {parameter_name}: {epv}")
        return ""

    except botocore.exceptions.ClientError as ec:
        logging.error(f"Error getting parameter {parameter_name}: {ec}")
        return ""
Variable Updates
My send_sns_message function needs some new variables. Firstly, I create an SNS Client using my existing boto3 session and assign it to client_sns:
    # AWS sessions and clients
    session = boto3.Session()
    client_ssm = session.client('ssm')
    client_s3 = session.client('s3')
    client_sns = session.client('sns')
    requests_session = requests.Session()
Next, I assign the new SNS parameter name to a parametername_snstopic object:
    # AWS Parameter Store Names
    parametername_s3bucket = '/s3/lakehouse/name/raw'
    parametername_snstopic = '/sns/pipeline/wordpressapi/raw'
    parametername_wordpressapi = '/wordpress/amazonwebshark/api/mysqlendpoints'
Finally, I create a new lambdaname object which I’ll use for SNS notifications in my Python script’s body.
    # Lambda name for messages
    lambdaname = 'wordpress_api_raw.py'
Script Body Updates
These changes integrate SNS failure messages into my script. There are no success messages…because I get enough emails as it is.
SNS Parameter Retrieval & Check
There’s now a third use of get_parameter_from_ssm, using parametername_snstopic to get the SNS topic ARN from AWS Parameter Store:
    # Get SNS topic from Parameter Store
    logging.info("Getting SNS parameter...")
    sns_topic = get_parameter_from_ssm(client_ssm, parametername_snstopic)
I’ve also added an SNS parameter check. It behaves differently to the other checks, as it’ll raise a ValueError if nothing is found:
    # Check an SNS topic has been returned.
    if not sns_topic:
        message = "No SNS topic returned."
        logging.warning(message)
        raise ValueError(message)
I want to cause an invocation failure in this situation, as not having the SNS topic ARN is a critical and unrecoverable problem which the automation process will have no way to alert me about.
However, the AWS Lambda service can warn me about invocation failures. This is something I’ll set up later on.
Failure Getting Other Parameters
The get_parameter_from_ssm response checks have changed. Previously, if a parameter request (the API endpoints in this case) returns a blank string then a warning is logged and the invocation ends:
    # Check the API list isn't empty
    if not any(api_endpoints_list):
        logging.warning("No API endpoints returned.")
        return
Now, new subject and message objects are created with details about the error. The message string is added to the log, and both objects are passed to send_sns_message along with the SNS client and SNS topic ARN:
# Check the API list isn't empty
if not any(api_endpoints_list):
message = "No API endpoints returned."
subject = f"{lambdaname}: Failed"
logging.warning(message)
send_sns_message(client_sns, sns_topic, subject, message)
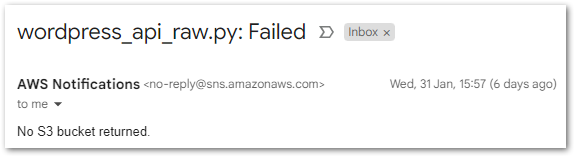
returnThe S3 check now works similarly:
    # Check an S3 bucket has been returned.
    if not s3_bucket:
        message = "No S3 bucket returned."
        subject = f"{lambdaname}: Failed"

        logging.warning(message)
        send_sns_message(client_sns, sns_topic, subject, message)
        return
If either of these checks fail, no WordPress API calls are made and the invocation stops.
Failure During For Loop
Previously, the script’s final output was a log entry showing the endpoint_count_success and endpoint_count_failure values:
logging.info("WordPress API Raw process complete: " \
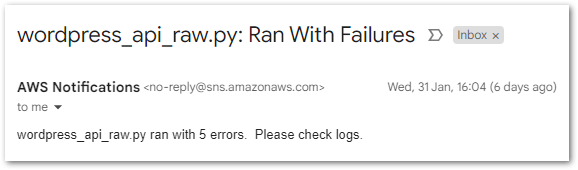
f"{endpoint_count_success} Successful | {endpoint_count_failure} Failed.")This section has now been expanded. If endpoint_count_failure is greater than zero, a message object is created including the number of failures.
message is then written to the log, and is passed to send_sns_message with a subject and the SNS client and SNS topic ARN:
    logging.info("WordPress API Raw process complete: " \
                 f"{endpoint_count_success} Successful | {endpoint_count_failure} Failed.")

    # Send SNS notification if any failures found
    if endpoint_count_failure > 0:
        message = f"{lambdaname} ran with {endpoint_count_failure} errors.  Please check logs."
        subject = f"{lambdaname}: Ran With Failures"

        logging.warning(message)
        send_sns_message(client_sns, sns_topic, subject, message)
If a loop iteration fails, the script ends it and starts the next. One or more loop iterations can fail while the others succeed.
That completes the script changes. Next, I’ll test the failure responses.
SNS Notification Testing
SNS should now send me one of two emails depending on which failure occurs. I can test these locally by inverting the logic of some if conditions.
Firstly, I set the S3 bucket check to fail if a bucket name is returned:
    # Check an S3 bucket has been returned.
    if s3_bucket:
        message = "No S3 bucket returned."
        subject = f"{lambdaname}: Failed"

        logging.warning(message)
        send_sns_message(client_sns, sns_topic, subject, message)
        return
Upon invocation, an email arrives with details of the failure:
Secondly, I change the loop’s data check condition to fail if data is returned:
        # If no data returned, record failure & end current iteration
        if api_json:
            logging.warning("Skipping attempt due to API call failure.")
            endpoint_count_failure += 1
            continue
This ends the current loop iteration and increments the endpoint_count_failure value. Then, in a check after the loop, an SNS message is triggered when endpoint_count_failure is greater than 0:
    # Send SNS notification if any failures found
    if endpoint_count_failure > 0:
        message = f"{lambdaname} ran with {endpoint_count_failure} errors.  Please check logs."
        subject = f"{lambdaname}: Ran With Failures"

        logging.warning(message)
        send_sns_message(client_sns, sns_topic, subject, message)
Now, a different email arrives with the number of failures:
Success! Now the Python script is working as intended, it’s time to deploy it to AWS.
Lambda & CloudWatch
In this section, I start creating the automation of my WordPress data extraction process by creating and configuring a new AWS Lambda function. Then I deploy my Python script, set some error handling and test everything works.
I made extensive use of Martyn Kilbryde‘s AWS Lambda Deep Dive A Cloud Guru course while completing this section. It was exactly the kind of course I needed – a bridge between theoretical certification content and hands-on experience in my own account.
This section is the result of my first pass through the course. There are better ways of doing what I’ve done here, but ultimately I have to start somewhere. I have several course sections to revisit, so watch this space!
Let’s begin with creating a new Lambda function.
Function Creation
Lambda function creation steps vary depending on whether the function is being written from scratch, or if it uses a blueprint or container image. I’m writing from scratch, so after choosing a name I must choose the function’s runtime. Runtimes consist of the programming language and the specific version. In my case, this is Python 3.12.
Next are the permissions. By design, AWS services need permissive IAM roles to interact with other services. A Lambda function with no IAM role cannot complete actions like S3 reads or CloudWatch writes.
Thankfully, AWS are one step ahead. By default, Lambda creates a basic execution role for each new function with some essential Amazon CloudWatch actions. With this role, the function can record invocations, resource utilization and billing details in a log stream. Additional IAM actions can be assigned to the role as needed.
Script Deployment
Now I have a function, I need to upload my Python script. There are many ways of doing this! I followed the virtual environment process, as I already had one from developing the script in VSCode. This environment’s contents are in the requirements.txt file listed in the Resources section.
While this was successful, the resulting deployment package is probably far bigger than it needs to be. Additionally, I didn’t make use of any of the toolkits, frameworks or pipelines with Lambda functionality. I expect my future deployments to improve!
Lambda Destination
There’s one more Lambda feature I want to use: a Lambda Destination.
From the AWS Compute blog:
With Destinations, you can route asynchronous function results as an execution record to a destination resource without writing additional code. An execution record contains details about the request and response in JSON format including version, timestamp, request context, request payload, response context, and response payload.
https://aws.amazon.com/blogs/compute/introducing-aws-lambda-destinations/
Here, I want a destination that will email me if my Lambda function fails to run. This helps with visibility, and will be vital if the SNS parameter isn’t returned!
With no Destination, the failure would only appear in the function’s log and I might not know about it for days. With a Destination enabled, I’ll know about the failure as soon as the email comes through.
My destination uses the following config:
- Invocation Type: Asynchronous
- Condition: On Failure
- Destination Type: SNS topic
The SNS topic is a general Failed Lambda one that I already have. The Lambda service can use this SNS topic regardless of any script problems.
Lambda & CloudWatch Testing
With the function created and deployed, it’s testing time! Does my function work and log as intended?
Error: Timeout Exceeded
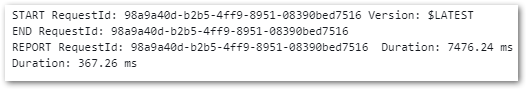
It doesn’t take long to hit my first problem:
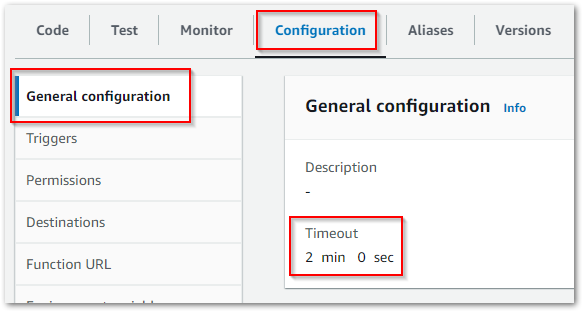
Task timed out after 3.02 secondsAll Lambdas created in the console start with a three-second timeout. This is great at preventing runaway invocations, but I clearly need longer than three seconds.
After some local testing, I increased the timeout to two minutes in the function’s config:
Error: Access Denied
Next, I start hitting permission errors:
An error occurred (AccessDeniedException) when calling the GetParameter operation: User is not authorized to perform: ssm:GetParameter on resource because no identity-based policy allows the ssm:GetParameter action.My Lambda’s basic execution role can interact with CloudWatch, but nothing else. This is by design in the interests of security. However, this IAM role is currently too restrictive for my needs.
The role’s policy needs to allow additional actions:
- Parameter Store’s
ssm:GetParameter - S3’s
s3:PutObject - SNS’s
sns:Publish
To follow IAM best practise, I should also apply least-privilege permissions. Instead of a wildcard character, I should restrict the policy to the specific ARNs of my AWS resources.
For example, this IAM policy is too permissive as it allows access to all parameters in Parameter Store:
{
	"Version": "2012-10-17",
	"Statement": [
		{
			"Sid": "Statement1",
			"Effect": "Allow",
			"Action": [
				"ssm:GetParameter"
			],
			"Resource": [
				"*"
			]
		}
	]
}
Conversely, this IAM policy allows access to specific parameter ARNs only.
(Well, it did before the ARNs were redacted – Ed.)
"Version": "2012-10-17",
    "Statement": [
        {
            "Sid": "VisualEditor0",
            "Effect": "Allow",
            "Action": [
                "ssm:GetParameter"
            ],
            "Resource": [
                "arn:aws:ssm:REDACTED",
                "arn:aws:ssm:REDACTED",
                "arn:aws:ssm:REDACTED"
            ]
        }
My S3 policy does have a wildcard value, but it’s at the prefix level:
{
    "Version": "2012-10-17",
    "Statement": [
        {
            "Effect": "Allow",
            "Action": [
                "s3:PutObject"
            ],
            "Resource": [
                "arn:aws:s3:::REDACTED/wordpress-api/*"
            ]
        }
My Lambda function can now write to my bucket, but only to the wordpress-api prefix. A good way to understand the distinction is to look at an AWS example:
arn:aws:s3:::my_corporate_bucket/*
arn:aws:s3:::my_corporate_bucket/Development/*
In this example, line 1 covers the entire my_corporate_bucket S3 bucket. Line 2 is more focused, only covering all objects in the Development prefix of the my_corporate_bucket bucket.
Error: Memory Exceeded
With the new policy, my function runs smoothly. Until:
Runtime exited with error: signal: killed Runtime.ExitErrorThis one was weird because the function kept suddenly stopping at different points! I then checked further down the test summary:
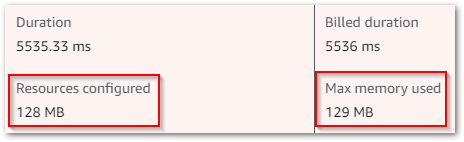
It’s running out of memory! Lambda assigns a default 128MB RAM to each function, and here my function was hitting 129MB. RAM can be changed in the function’s general configuration. But changed to what?
When a Lambda function runs successfully, it logs memory metrics:
Memory Size: 500 MB Max Memory Used: 197 MBAfter some trial and error, I set the function’s RAM to 250MB and have had no problems since.
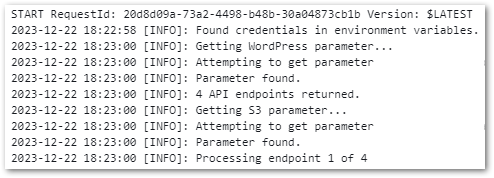
Incomplete CloudWatch Logs
The last issue wasn’t an error so much as a bug. CloudWatch was showing my Lambda invocation start and end, but none of the function’s logs:
The solution was found in Python’s basicConfig‘s docstring:
This function does nothing if the root logger already has handlers configured, unless the keyword argument
forceis set toTrue.basicConfigdocstring
Well, AWS Lambda does have built-in logging. And my basicConfig isn’t forcing anything! One swift update and redeployment later:
    logging.basicConfig(
        level = logging.INFO,
        format = "%(asctime)s [%(levelname)s]: %(message)s",
        datefmt = "%Y-%m-%d %H:%M:%S",
        force = True
        )
And my CloudWatch Log Stream is now far more descriptive!
In the long run I plan to investigate Lamba’s logging abilities, but for now this does what I need.
SNS Destination Email
Finally, I want to make sure my Lambda Destination is working as expected. My function works now, so I need to force a failure. There are many ways of doing this. In this case, I used three steps:
- Temporarily alter the function’s timeout to 3 seconds.
- Reconfigure the function’s Asynchronous Invocation retry attempts to zero.
- Invoke the function with a one-time EventBridge Schedule.
The low timeout guarantees a function invocation failure. Setting zero retries prevents unnecessary retries (because I want the failure to happen!) Finally, the one-time schedule will asynchronously invoke my function, which is what the Destination is looking for.
And…(redacted) success!
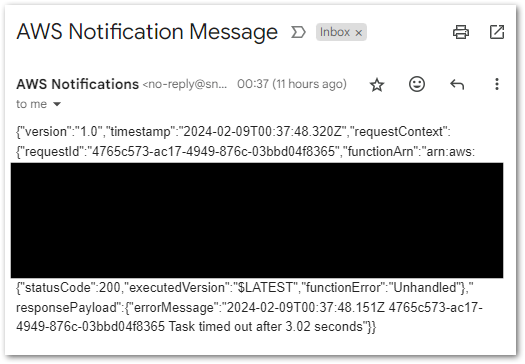
I could clean this email up with an EventBridge Input Path (which I’ve done before), but that’s mostly cosmetic in this case.
EventBridge
In this section I configure EventBridge – the AWS service that schedules the automation of my WordPress data extraction process. While I’ve used EventBridge Rules before, this is my first time using EventBridge Scheduler. So what’s the difference?
EventBridge Scheduler 101
From the AWS EventBridge product page:
Amazon EventBridge Scheduler is a serverless scheduler that enables you to schedule tasks and events at scale. With EventBridge Scheduler you have the flexibility to configure scheduling patterns, set a delivery window, and define retry policies to ensure your critical tasks and events are reliably triggered right when you need them.
https://aws.amazon.com/eventbridge/scheduler/
EventBridge Scheduler is a fully managed service that integrates with over 200 AWS services. It supports one-time schedules and start and end dates, and can account for daylight saving time.
Cost-wise, EventBridge Schedules are changed per invocation. EventBridge’s free tier covers the first 14 million(!) invocations each month, after which each further million currently costs $1.00. These invocations can be staggered using Flexible Time Windows to avoid throttling.
AWS has published a table showing the main differences between EventBridge Scheduler and Eventbridge Rules. Essentially, Eventbridge Rules are best suited for event-based activity, while EventBridge Scheduler is best suited for time-based activity.
Schedule Setup
Let’s create a new EventBridge Schedule. After choosing a name, I need a schedule pattern. Here, I want a recurring CRON-based schedule that runs at a specific time.
EventBridge Cron expressions have six required fields which are separated by white space. My cron expression is 0 7 * * ? * which translates to:
- The 0th minute
- Of the seventh hour
- On every day of the month
- Every month,
- Day of the week,
- And year
In response, EventBridge shows some of the future trigger dates so I can check my expression is correct:
Sat, 02 Feb 2024 07:00:00 (UTC+00:00)
Sun, 03 Feb 2024 07:00:00 (UTC+00:00)
Mon, 04 Feb 2024 07:00:00 (UTC+00:00)
Tue, 05 Feb 2024 07:00:00 (UTC+00:00)
Wed, 06 Feb 2024 07:00:00 (UTC+00:00)
I then need to choose a flexible time window setting. This setting distributes AWS service API calls to help prevent throttling, but that’s not a problem here so I select Off.
Next, I choose the target. I have two choices: templated targets or universal targets. Templated targets are a set of popular AWS service operations, needing only the relevant ARN during setup. Universal targets can target any AWS service but require more configuration details. Lambda’s Invoke operation is a targeted template, so I use that.
Next are some optional encryption, retry and state settings. EventBridge Scheduler IAM roles are handled here too, allowing EventBridge to send events to the targeted AWS services. Finally, a summary screen shows the full schedule before creation.
The schedule then appears on the EventBridge console:
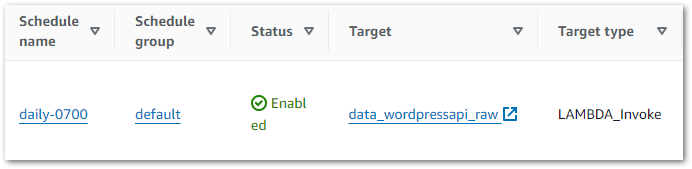
EventBridge Testing
Testing time! Does CloudWatch show Lambda function invocations at 07:00?
It does!
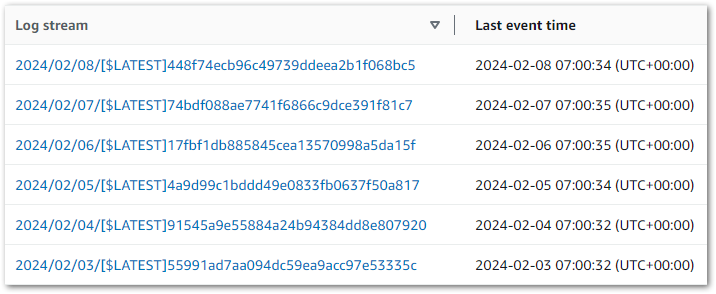
While I’m in CloudWatch, I’ll change the log group’s retention setting. It defaults to Never Expire, but I don’t need an indefinite history for this function! Three months is fine – long enough to troubleshoot any errors, but not so long that I’m storing and potentially paying for logs I’ll never need.
Costs
In this section, I examine the current AWS costs for my WordPress data extraction and automation processes using the Billing & Cost Management console.
I began creating pipeline resources in December 2023 using various workshops and tutorials. This table shows my AWS service costs (excluding tax) accrued over December 2023 and January 2024 (the months I currently have full billing periods for):
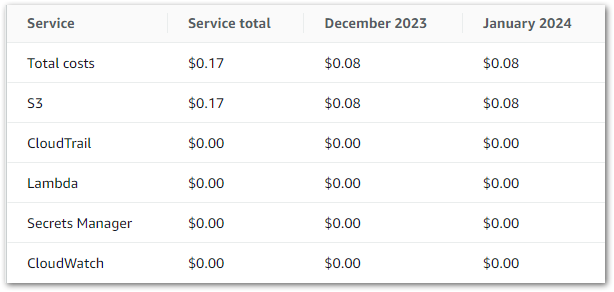
I’ll examine these costs in two parts:
- S3 Costs: my AWS costs are all storage-based. I’ll examine my S3 API calls and how each S3 API contributes to my bill.
- Free Tier Usage: everything else has zero cost. I’ll examine what I used and how it compares to the free tier allowances.
I’ll also take a quick look at February’s costs to date. I’ve not tagged any of the pipeline resources, so these figures are for all activity in this AWS account.
S3 Costs
S3 is the only AWS service in my WordPress data extraction and automation processes that is generating a cost. This Cost Explorer chart shows my S3 API usage over the last two full months:
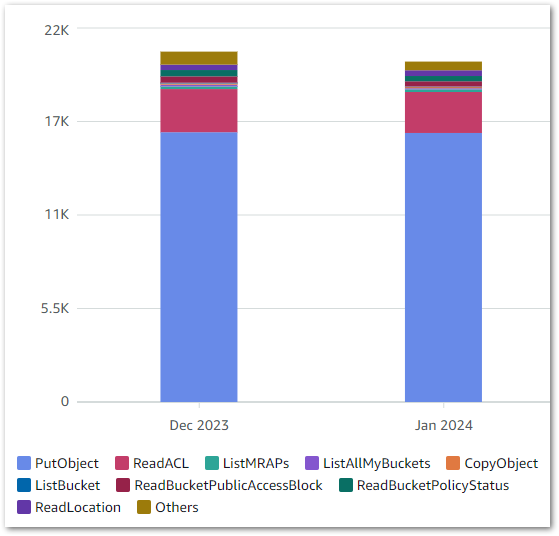
PutObject is clearly the most used S3 API, which isn’t surprising given S3’s storage nature. Cost Explorer can also show API request totals, as shown below:
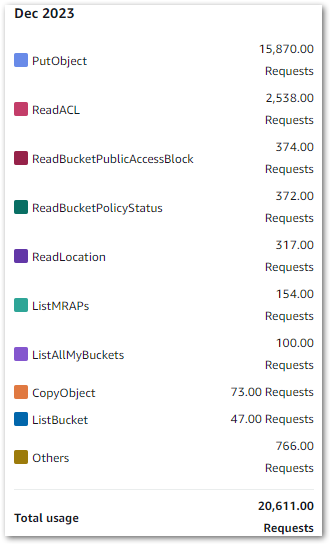
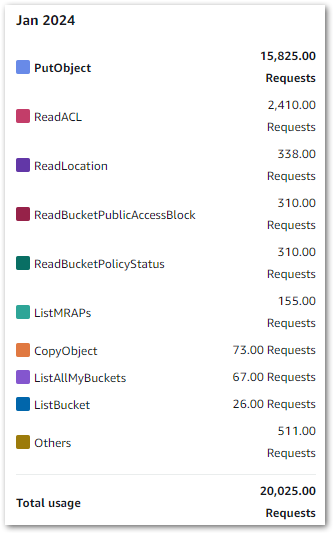
Remember that this includes S3 API calls from other services like S3 Inventory, CloudTrail Log Steams and Athena queries.
AWS bills summarise these figures for easier reading. This is my December 2023 S3 bill, where S3 PUT, COPY, POST and LIST requests are grouped:
January 2024’s bill:
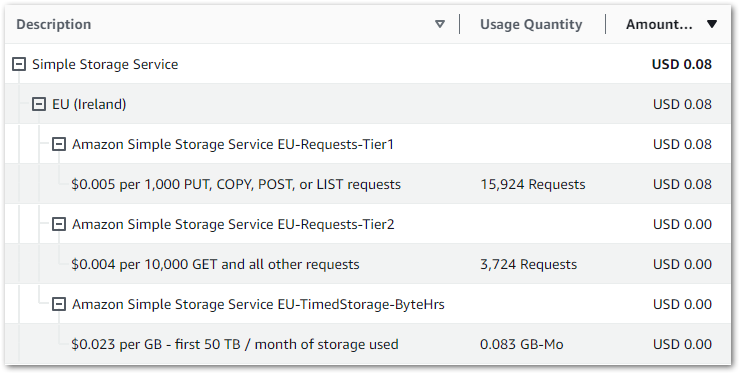
Going into this depth for $0.08 might not seem worth it. But if the bill suddenly becomes $8 or $80 then having this knowledge is very useful!
The AWS Storage blog has a great post on analyzing S3 API operations that really helped here.
Free Tier Usage
The following services had no cost because my usage fell within their free tier allowances. For each zero cost on the bill, I’ll show the service and, where appropriate, the respective free tier allowance.
CloudTrail:
- 2023-12: 7970 Events recorded.
- 2024-01: 6605 Events recorded.
CloudWatch was the same for both months:
- Sub 1GB-Mo log storage used of 5GB-mo log storage free tier
- Sub 1GB log data ingested of 5GB log data ingestion free tier
Lambda 2023-12:
- 36.976 GB-Seconds used of 400,000 GB-seconds Compute free tier
- 47 Requests used of 1,000,000 Request free tier
Lambda 2024-01:
- 9.572 GB-Seconds used of 400,000 GB-seconds Compute free tier
- 8 Requests used of 1,000,000 Request free tier
Parameter Store (billed as Secrets Manager):
- 2023-12: 31 API Requests used of 10,000 API Request free tier
- 2024-01: 41 API Requests used of 10,000 API Request free tier
February 2024 Costs
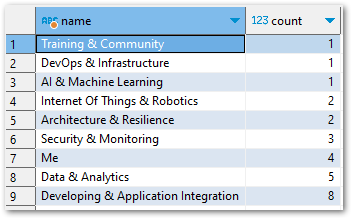
At this time I don’t have full billing data for February, but I wanted to show the EventBridge and SNS usage to date:
EventBridge (billed as CloudWatch Events):
- 16 Invocations used of 14 million free tier
SNS:
- 3 Notifications used of 1,000 Email-JSON Notification free tier
- 227 API Requests used of 1,000,000 API Request free tier
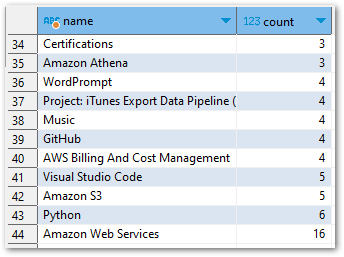
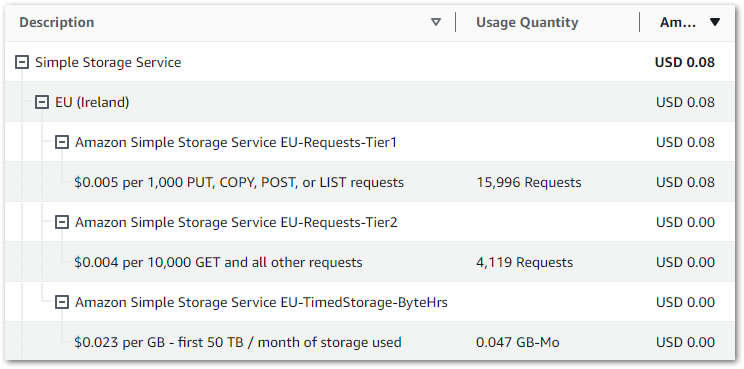
As of Feb 15, Lambda is on 71.742 GB-Seconds and 34 Requests while S3 is on 8,821 PCPL requests, 3,764 GET+ requests and 0.0052 GB-Mo storage.
Resources
The full Python script has been checked into the amazonwebshark GitHub repo, available via the button below. Included is a requirements.txt file for the Python libraries used to extract the WordPress API data. This file is unchanged from last time but is included for completeness.

Summary
In this post, I set up the automation of my WordPress API data extraction script with AWS managed serverless services.
On the one hand, there’s plenty more to do here. I have lots to learn about Lambda, like deployment improvement and resource optimisation. This will improve with time and experience.
However, my function’s logging and alerting are in place, my IAM policies meet AWS standards and I’m using the optimal services for my compute and scheduling. And, most importantly, my automation pipeline works!
My attention now turns to the data itself. My next WordPress Data Pipeline post will look at transforming and loading the data so I can put it to use! If this post has been useful, the button below has links for contact, socials, projects and sessions:

Thanks for reading ~~^~~